

You're trying to build a "Pages and screens" report in Google Analytics 4. You add the Views metric easily enough. But when you try to add the Exits metric... it's nowhere to be found in Standard Reports. And even if you could find it, there's still no Exit Rate calculation available.
It’s one of the most common frustrations with GA4’s standard reports. The raw ingredients are available deep in the tool, but the final dish is missing. The official answer usually involves exporting your data to a spreadsheet.
But what if you could get the answer in 30 seconds without ever leaving the report you're already in?
The Problem: Google Has Hidden the Exit Metric
In Universal Analytics, Exit Rate was a standard, out-of-the-box metric. In GA4, Google has made it significantly harder to access exit data:
- Standard Reports: The
Exitsmetric is completely unavailable in Standard Reports. You can't even add it manually. (Unless thrrough workaround below) - Explorations Only: The
Exitsmetric is only available in Explorations, but even there, you have to manually manually export and calculate the Exit Rate inside of Google Sheets or Excel spreadsheet. - Looker Studio Dead End: Even Google's own Looker Studio doesn't allow the "Exits" metric to be used.
The result? Most users either give up on exit analysis entirely or get stuck in a tedious workflow of building Explorations, exporting to spreadsheets, and manually calculating rates.
The Solution: One-Click Exit Analysis
The GA4 Optimizer Chrome Extension solves this problem with a "Create Exit Pages Report" feature that bypasses Google's restrictions entirely.
The Fastest Method: One-Click Exit Pages Report Template
This is the most direct solution for exit analysis. Instead of fighting with GA4's limitations, you get a pre-configured report with everything you need. However it does require "Editor" or higher role access.
- Access from Popup: When you're on any GA4 property page, open the GA4 Optimizer extension popup and navigate to the "Reports" tab.
- One-Click Setup: Click the "Create Exit Pages Report" button. Your current tab will be redirected to the GA4 "Create a new report" screen.
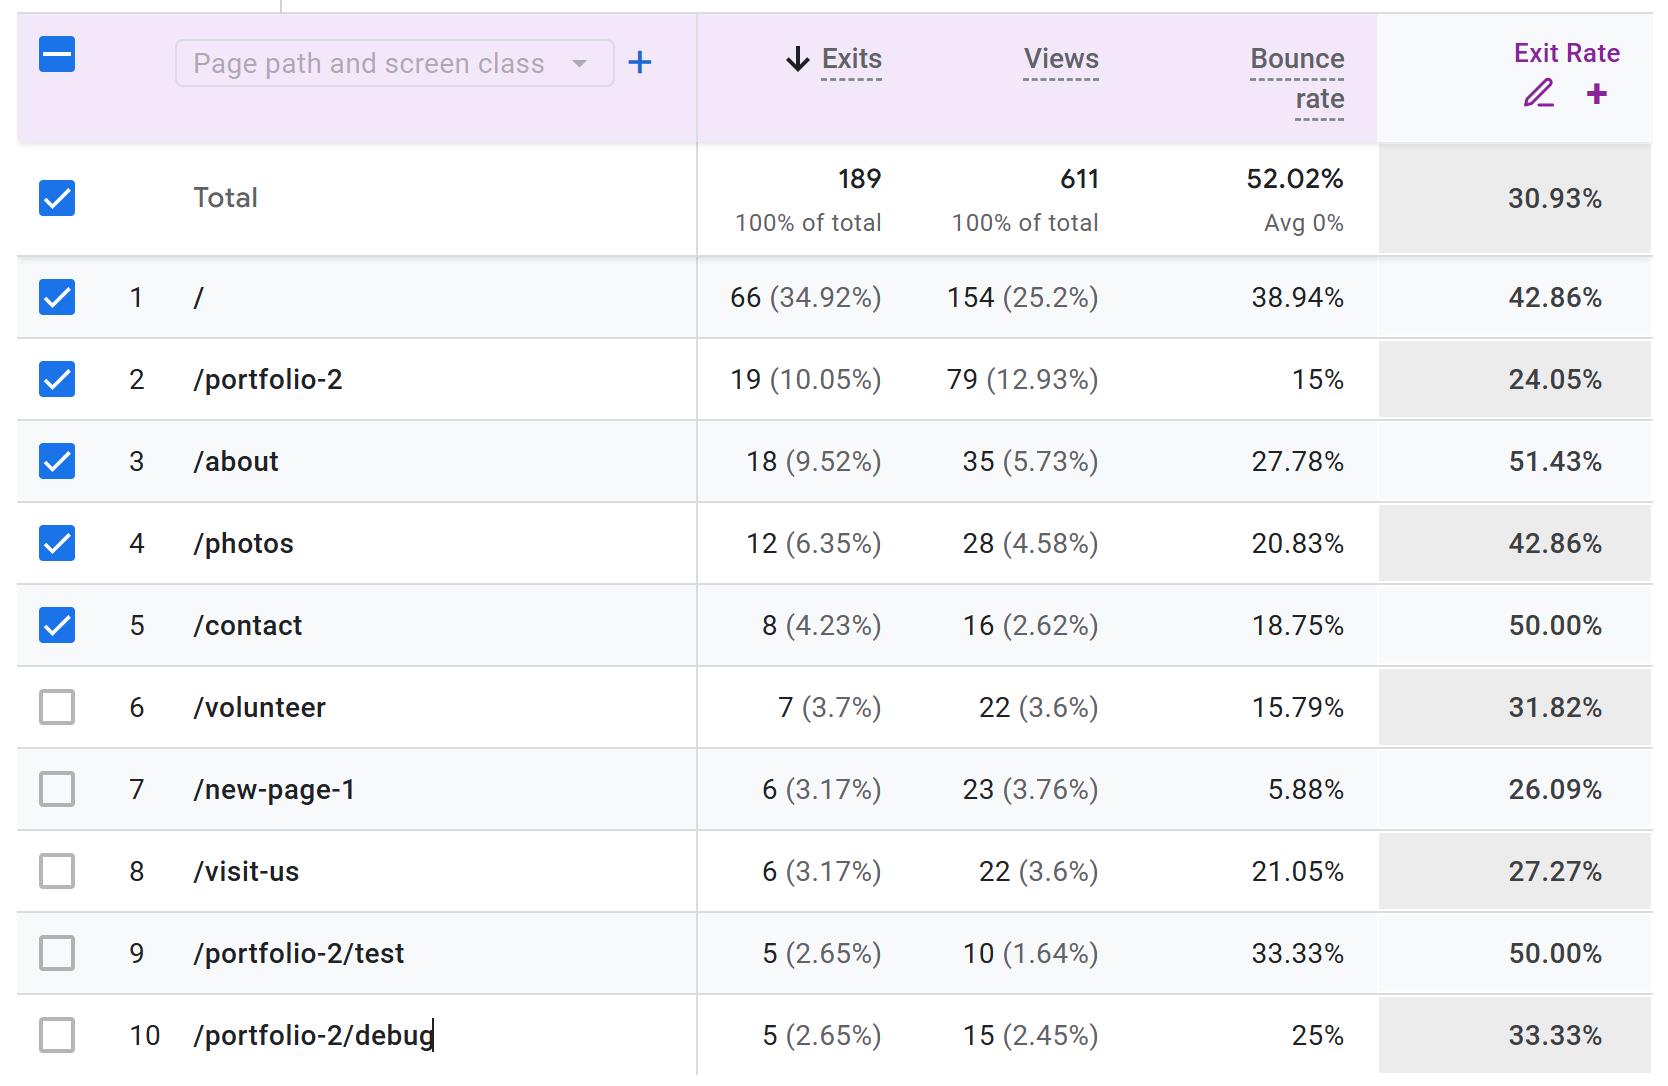
- Pre-Configured Template: The report template comes pre-filled with Exits, Views, and Bounce Rate metrics, using Page Path as the primary dimension.
- Save and Use: You can then save this report to your library for future use. The Exit Rate column will automatically appear thanks to the calculated metric functionality.
- Activate in Reports Collection: Once Saved, it will bring you to your Reports Library. Here you can Choose one of the collections like "Business objectives" edit it and then drag your new Exit Rate Report into it. Once saved, you will see this new report show up in your GA4 Reports under the collection into which you dragge Exit Rate Report into.
This method is perfect because it gives you a dedicated exit analysis report that you can save, share, and revisit regularly. It's especially valuable since the "Exits" metric is normally hidden from the standard GA4 Report Builder UI.
Alternative Method: Enhancing Tooltips in Explorations
If you're already working in Explorations and want to add exit rate calculations to an existing report, the extension's Quick Calculated Metric feature can help.
- Setup Up Exits and Views Exploration: Add Exits and Views as metrics and Page path and screen class as the dimension your report.
- Right-Click the Header: In your Exploration table, right-click on the header of the
Exitsmetric. - Configure: In the Optimizer menu that appears, choose to create a new calculation. A modal will pop up allowing you to select
Viewsas the Denominator, set the format to percentage, and optionally save the calculation to your library. - Analyze on Hover: Now, simply hover over any
Exitsvalue in the table. The tooltip will automatically show you the calculated Exit Rate for that specific row, without you having to add another column to your report.
This method works well for quick analysis within existing Explorations, but for dedicated exit analysis, the one-click report template is usually the better choice.
What to Look For: Interpreting Exit Rate
Once you have the Exit Rate, the next step is to understand what it's telling you. A "high" exit rate isn't always bad, it depends entirely on the page's purpose.
-
High Exit Rate is OK here:
- Thank You / Confirmation Pages: A user has just completed a purchase or form. Leaving from this page is expected and normal.
- Contact Us / Support Pages: The user found the information they needed (an address, a phone number) and is now leaving.
- Blog Posts (to a degree): A user might read an article and leave satisfied. However, a very high exit rate could mean you're failing to guide them to other relevant content.
-
High Exit Rate is a RED FLAG here:
- Shopping Cart / Checkout Funnel: A high exit rate on any step before the final "thank you" page indicates a serious problem. Users are abandoning their purchase due to cost, complexity, or technical issues.
- Multi-Step Forms: If users are dropping off in the middle of a sign-up or lead generation form, it's likely too long or asks for confusing information or the traffic that is being sent there is not proper.
- Key Landing Pages: If a page designed to drive users deeper into your site has a high exit rate, the call-to-action may be weak or the content might not match the user's expectation from the ad or link they clicked.
By using the Exit Rate that comes from our Quick Calculated Metric, you can spend less time wrestling with reports and more time analyzing these user journeys and fixing the leaks that are costing you conversions.
Frequently Asked Questions (FAQ)
Q: How do you calculate Exit Rate in a GA4 report?
A: Exit Rate is calculated as Exits ÷ Views for a specific page. However, Google has hidden the "Exits" metric from Standard Reports entirely, making it only available in Explorations. The fastest solution is to use the GA4 Optimizer extension's "Create Exit Pages Report" feature, which generates a pre-configured report template with Exits, Views, and automatic Exit Rate calculations. This bypasses Google's restrictions and gives you a dedicated exit analysis report you can save and reuse.
Q: How do you find which pages have a high Exit Rate in GA4?
A: The easiest way is to use the GA4 Optimizer extension's "Create Exit Pages Report" feature, which generates a pre-configured report with Page Path as the dimension and automatic Exit Rate calculations. Once you have this report, you can sort by Exit Rate to identify your highest-exit pages. Since Google doesn't allow the "Exits" metric in standard reports, this one-click template is the fastest way to get the analysis you need.
Q: What's the difference between Exit Rate and Bounce Rate in GA4?
A: Exit Rate is page-specific: it’s the percentage of times a page was the last one viewed in a session (Exits / Views). A high exit rate on a 'thank you' page is normal, but on a checkout page, it could indicate a problem. Bounce Rate is session-specific: it’s the percentage of sessions that were not 'engaged' (e.g., lasted under 10 seconds, had no conversion, and had fewer than 2 pageviews). It signals that a user arrived and left without meaningful interaction.