
Browser Extension That Makes GA4 Usable Again.
Stop wasting time on repetitive clicks, broken links, and missing features. GA4 Optimizer gives you the tools Google left out, so you can get answers in seconds instead of minutes. 100% free and private.
Add GA4 Optimizer to Chrome - It's FreeWhy You'll Love GA4 Optimizer
Bring Back UA Features
Advanced Table Filters, Exit Pages reports, and the workflows Google removed.
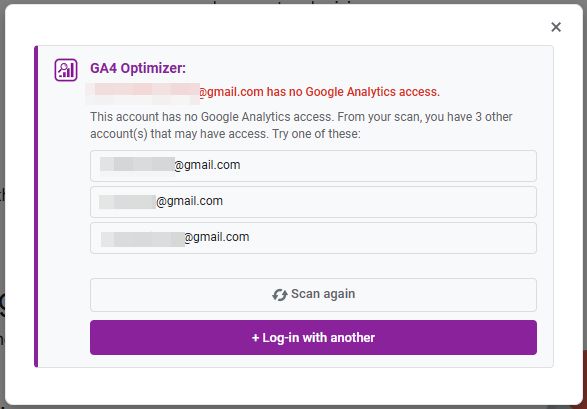
Fix Shared Links
No more "Missing Permissions" errors on links from colleagues.
Instant Date Controls
Override locked dates and add 1-click comparison periods.
100% Private
Runs locally in your browser. No data ever leaves your machine.
Built for Your Workflow
Data Analysts
Spend less time wrestling with the interface and more time finding insights. Get automatic statistical significance on A/B tests, bypass sampling with one shortcut, and extract data without exporting to spreadsheets first. Document events in the built-in Data Dictionary and log data incidents across all properties at once with Bulk Annotations.
Digital Marketers
Spot campaign performance shifts the moment they happen. Percentage change highlighters, a sticky calculator, and hover-based metric definitions mean fewer questions and faster decisions.
SEO Professionals
Find underperforming landing pages in seconds. Filter by page path, see exit rates at a glance, and use the same efficient workflows you relied on in Universal Analytics.
Agencies
Set up new client properties in minutes instead of hours. Copy custom dimensions between properties with one click, log campaign launches across every client with Bulk Annotations, and keep everyone aligned with a shared Data Dictionary and Team Sync.
Reporting & Analysis Enhancements
Advanced Table Filters
Instantly narrow thousands of rows to the exact data you need. Set conditions like "Views > 10,000" or "Page path contains /shop" and only matching rows appear. No more scrolling or manual searching.
Learn how to use Advanced Table Filters
Percentage Change Highlighter
Spot the metrics that need your attention at a glance. Color-coded formatting makes significant increases and drops impossible to miss during weekly reviews. Customize thresholds and colors to match your reporting standards.
Quick Calculated Metric
Build rate columns like conversions/sessions directly in your report. No Admin access required, no waiting on your analytics team to configure it. Save your favorites for instant reuse.
Date Range Presets
Stop clicking through the calendar picker every single time. One-click buttons for Last 7 Days, Month-over-Month, Year-over-Year, and more. Includes a Compare button with three modes for accurate period-over-period analysis.
See all available date presets
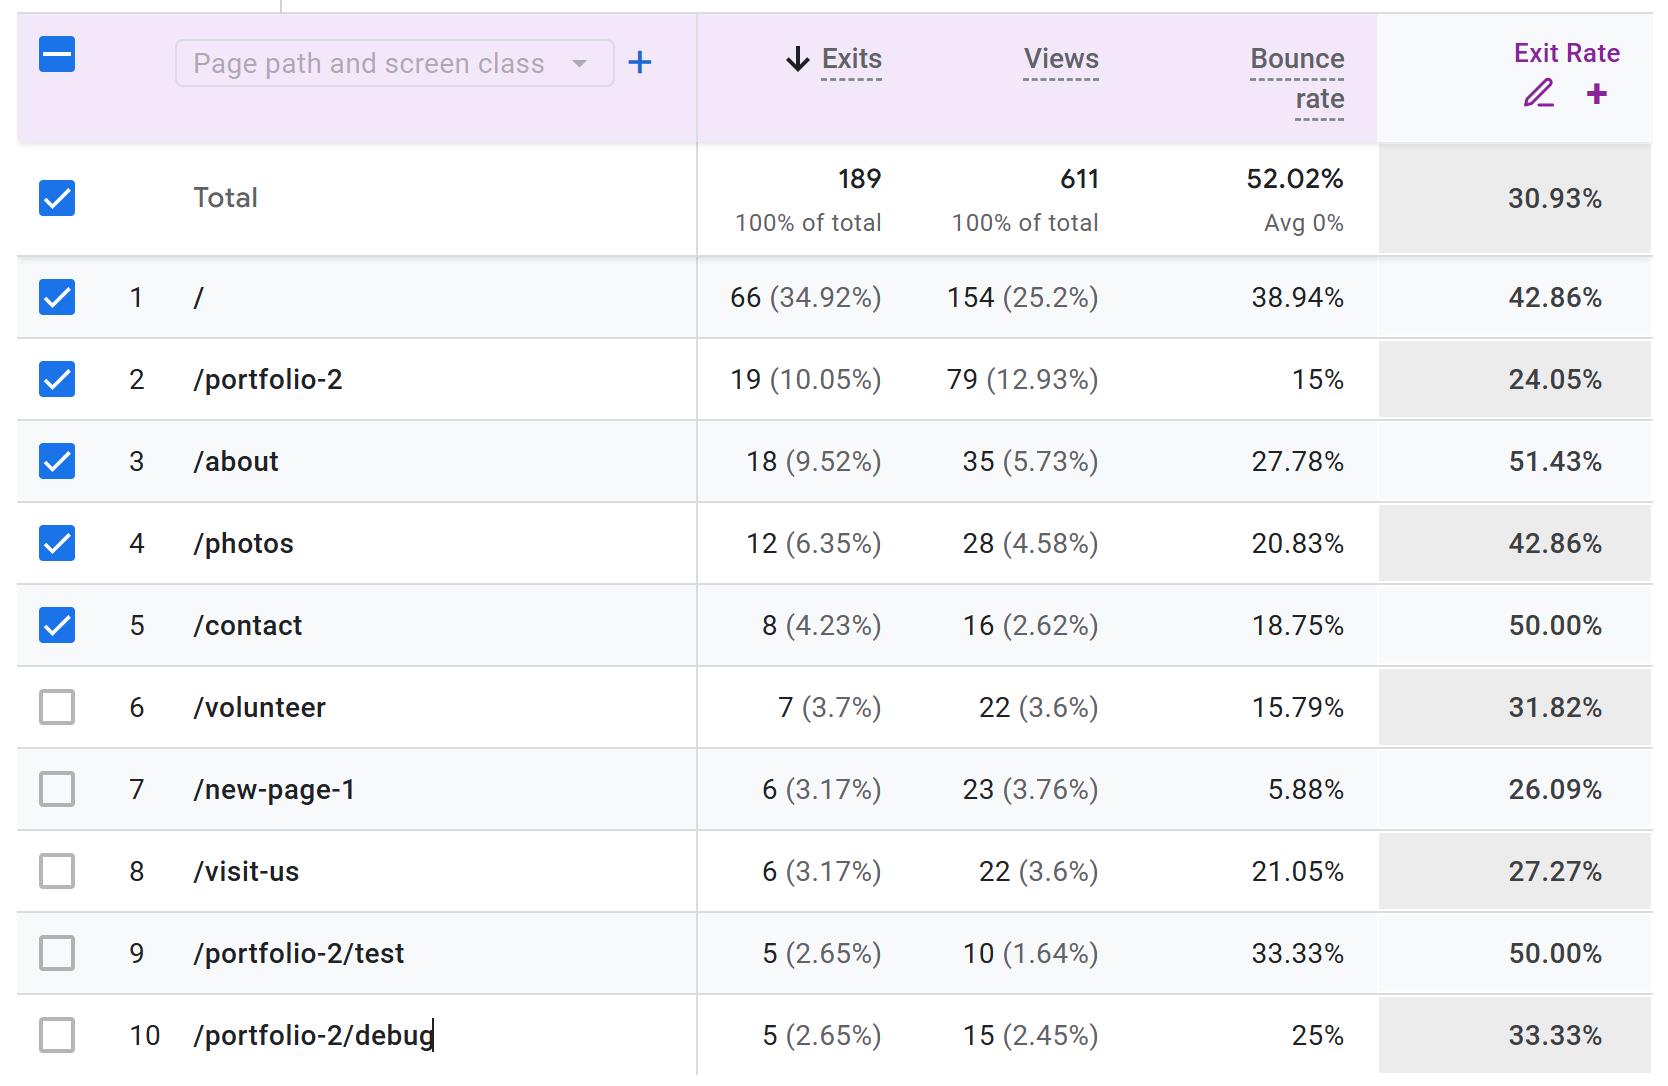
Exit Pages Report
GA4 removed the Exits metric from the Report Builder UI, but your data still has it. This feature instantly generates a Standard Report pre-filled with Exits, Views, and Bounce Rate so you can find where users are dropping off without building a custom Exploration.
Full guide to exit rate in GA4
Data Dictionary
Stop asking "what does this event mean?" Your tracking plan definitions appear as hover tooltips right inside GA4. Ships with 80+ standard GA4 definitions, supports CSV import and Google Sheets auto-sync so your whole team stays aligned.
Exploration Power Tools
Annotations in Explorations
Finally understand why a metric spiked or dropped. Colored dots on your line charts show the annotations GA4 normally hides in Explorations. Hover for details, or open the full list from the toolbar.
Exploration View Enhancer
Reclaim your screen space. Collapse side panels, jump to 500 rows with Shift+M, and navigate pages with keyboard shortcuts instead of digging through settings. Auto-maximize on load is also available.
% of Column Total
Instantly see how much each row contributes to the total on hover. No calculator or export needed. Perfect for quick contribution analysis during stakeholder meetings.
Learn more about % of Column Total
Detailed Results Shortcut
Get more accurate data with one keyboard shortcut. Reduces sampling so your numbers actually reflect reality. No more wondering if that dip is real or just a sampling artifact.
AB Test Comparison
Know whether your test results are real. Automatic statistical significance and sample ratio mismatch checks save you from acting on noise. Just name your segments with the VAR- prefix and the math is done for you.
Read the full A/B testing guide
Date Range Override
Analyze any time period on shared Explorations without waiting for the owner to update the dates for you. Pick your dates, hit Apply, and GA4 fetches fresh data. Session-only, never modifies the original.
See how Date Range Override works
Line Chart Color Customization
Make your charts presentation-ready. GA4 Exploration line charts default to all blue, making it difficult to differentiate elements. Override this instantly with custom colors so you can easily spot what you're looking for.
Workflow & UI Fixes
Fix Shared Links
Google's multiaccount system complicates sharing report links. We put together a fix: when a colleague sends a GA4 link and you get a permissions error, a "Try Another Account" button appears automatically so you can switch accounts in one click. No more dead-end error pages.
Click to Copy
Stop retyping values into spreadsheets. Click any cell, header, or label and it's on your clipboard instantly. Configure single, double, and triple-click behaviors to match your workflow.
Sticky Header
Never lose track of which column you're reading. Headers stay pinned as you scroll through long reports. No need to constantly scroll back and forth.
Highlight Sampling
Know when your data is unreliable before you make decisions on it. A pulsing icon alerts you the moment sampling kicks in, so you never present inaccurate numbers to stakeholders.
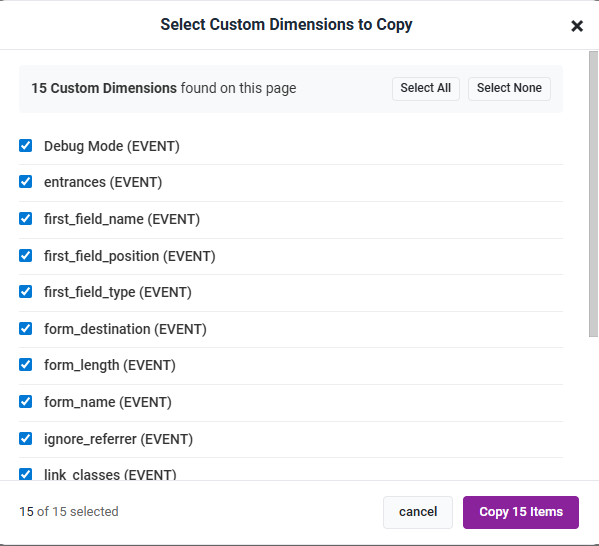
Custom Definitions Copy/Paste
Setting up a new property? Copy all your dimensions, metrics, and calculated metrics from an existing one in seconds instead of recreating them manually. Automatically skips duplicates and shows real-time progress.
Learn more about copying definitions
Sticky Calculator
Compare conversion rates without switching tabs. A floating calculator is always available on any GA4 page. Calculate two CRs and instantly see the absolute difference and relative uplift.
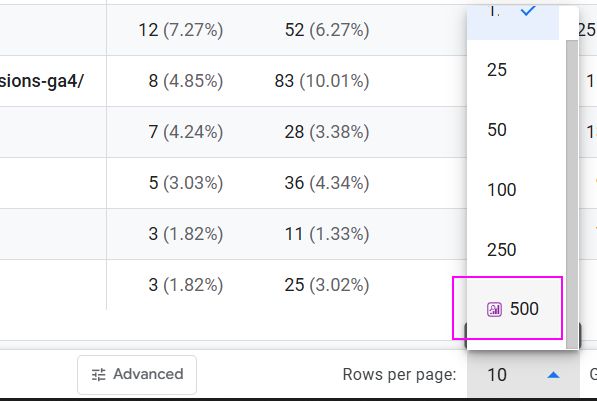
500 Rows per Page
See the full picture without paginating. GA4 caps you at 250 rows; this doubles it so you can scan all your pages, events, or campaigns at once. Ideal for large reports where you need everything visible.
Team Sync & Sharing
Get your entire team on the same configuration without manual setup. Export your Calculated Metrics, Annotation Labels, and highlight ranges as a JSON file or shareable code. Teammates import in one click, or connect a hosted URL for automatic background syncing.
- Export/import via file, code, or hosted URL
- Per-metric sharing with a single copy button
- Auto-sync from a team URL on startup
- No backend, no accounts, 100% local
Exact Numbers on Hover
GA4 abbreviates large numbers on the Home screen ("24K", "2.4M"). Hover any abbreviated metric to see the full exact value pulled from the API response. No extra requests, no exporting needed.
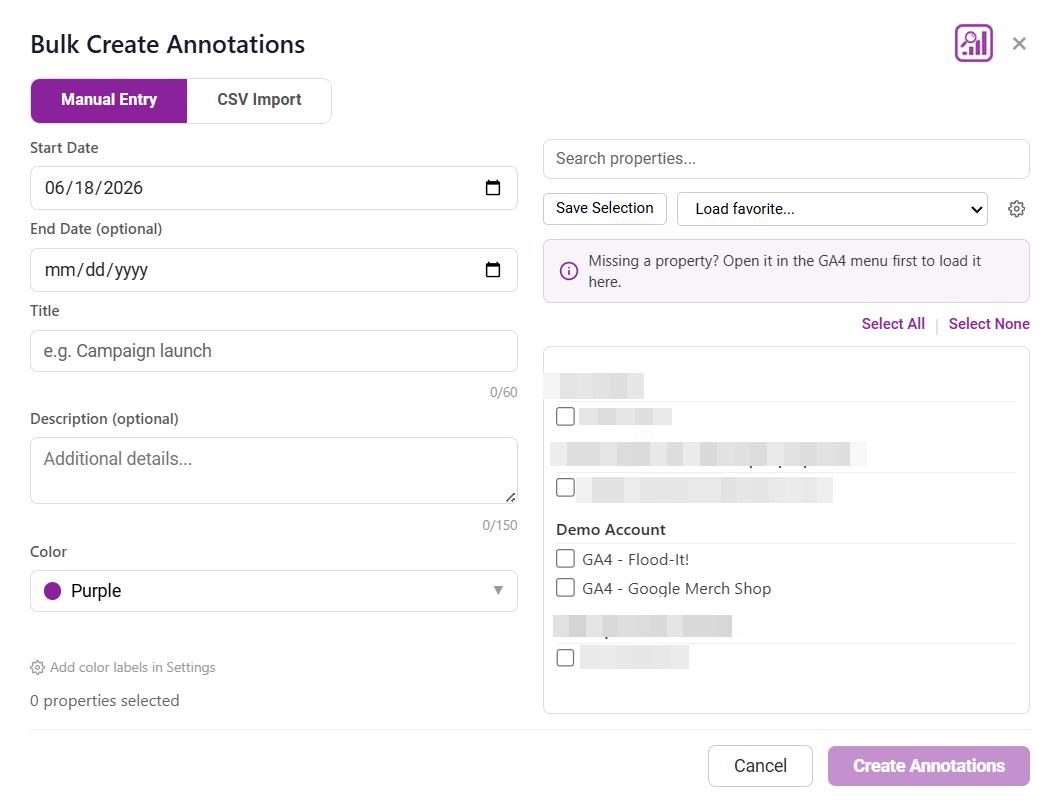
Bulk Annotations
Save hours of manual data entry by creating annotations across dozens of properties at once. Log algorithm updates, site redesigns, or marketing campaigns across your entire organization in seconds instead of one property at a time.
- Manual Entry: Set a date, title, description, and color, then select which properties should receive the annotation.
- CSV Import: Export annotations from one GA4 property using GA4's native export, then import that CSV to replicate them across other properties.
- Favorite Selections: Save frequently-used property groups so you can annotate the same set with one click.
- Date Ranges: Supports both single-day annotations and date ranges (start to end).
Frequently Asked Questions
The Click to Copy feature allows you to quickly copy values from table cells, headers, or dimension labels in both Explorations and Standard Reports, making it easier to export data to spreadsheets or presentations.
This is a powerful tool for conversion rate optimization (CRO) that compares metrics between test variations in your Exploration reports. It automatically calculates statistical significance and checks for sample ratio mismatch (SRM) to validate your test results. Segments must be named with a VAR- prefix for it to work.
This feature adds one-click buttons for common date ranges and comparison periods (like "Last 7 Days" or "Month-over-Month") to the standard GA4 reports, saving you from manually selecting dates in the calendar every time. It also includes a Compare button with three modes: vs. Previous Period, vs. Last Year, and vs. Last Year (Day of Week Aligned) for accurate year-over-year comparisons.
The Exploration View Enhancer is a suite of three tools for Freeform Explorations: Collapsible Panels to hide the Variables and Tab Settings panels for more screen space; Maximize View (Shift+M shortcut) to instantly set 500 rows and 20 column groups; and Pagination Controls with a floating bar and keyboard shortcuts (Alt+arrows) to navigate large datasets without opening the Settings panel.
Use the Custom Definitions Copy/Paste feature on the Admin > Custom definitions page. Click the Copy button on the source property, then navigate to the destination property and click Paste. It supports custom dimensions, custom metrics, and calculated metrics, automatically skips duplicates, and shows real-time progress. Requires Editor or Administrator role on both properties.
This feature adds a 500 option to the Rows per page dropdown in Standard Reports, which normally maxes out at 250. Enable it in the popup under the Reports tab, then open any Standard Report, scroll to the bottom, and select 500 from the dropdown. Ideal for large reports where you need the full picture without paginating.
The Quick Calculated Metric feature lets you create temporary or saved calculated metrics on-the-fly. In Standard Reports, it adds a new interactive column. In Explorations, it enhances tooltips with calculated rates when you right-click a metric header. You can save metrics to your personal library and choose to auto-apply them.
This feature instantly generates a new Standard Report template pre-filled with Exits, Views, and Bounce Rate metrics, using Page Path as the primary dimension. It provides a crucial workaround since the "Exits" metric is not available in the standard GA4 Report Builder UI. You can access it from the extension popup when on any GA4 property page.
Date Range Override lets you change the date range on read-only shared Explorations that GA4 normally locks. An "Edit Date" button appears in the Variables panel, letting you pick any start and end date and reload the data. The override is session-only and never modifies the original shared report. It also supports comparison date ranges if the original Exploration had one active.
Advanced Table Filter brings back Universal Analytics-style filtering to GA4 Standard Reports. You can set conditions like "Views > 10,000" or "Page path contains /shop" and GA4 returns only matching rows. Combine multiple conditions with AND logic. Look for the "Advanced" button in the table controls bar next to Search and Rows per page.
GA4 strips annotations from Explorations, but this feature brings them back. Colored dots appear on line chart x-axes at annotation dates, and a toolbar button opens a full scrollable list. Annotations are color-coded to match your GA4 Standard Reports colors, and you can assign custom labels to each color in Settings.
Team Sync lets you export your GA4 Optimizer configuration (Calculated Metrics, Annotation Labels, PCH Ranges) as a JSON file or shareable code. Teammates import via paste, file upload, or a hosted URL that auto-syncs on startup. No backend or accounts needed. Everything stays local unless you explicitly export or connect a URL you control.
The Data Dictionary surfaces your tracking plan definitions as hover tooltips directly inside GA4. Info icons appear next to event names, dimensions, and metrics in reports, explorations, and dimension pickers. It ships with 80+ standard GA4 definitions, supports CSV import and Google Sheets auto-sync, and uses a scope cascade (Property > Account > Global) for team governance.
GA4 abbreviates large numbers on the Home screen (e.g., "24K", "2.4M"). This feature adds a purple dashed underline to hoverable numbers. On hover, the full exact value appears (e.g., "24,390"). It reads data GA4 already fetched from its API, so no extra network requests are made.
Bulk Annotations lets you create annotations across multiple GA4 properties at once from the Admin Annotations page or the native annotation panel. Enter a date, title, description, and color (or import a CSV from GA4's native export), select which properties should receive the annotation, and click Create. You can also save favorite property selections for repeated use. Requires access to the target properties.
Ready to Get More Done in GA4?
Join hundreds of marketers and analysts who spend less time clicking and more time finding insights. Your data never leaves your browser. No servers, no tracking, just a better Google Analytics.
Add GA4 Optimizer to Chrome