GA4 Optimizer Documentation
GA4 Optimizer aims to solve common analysis needs when using Google Analytics™ 4 interface. This guide explains what each feature does and how to use it. Please note that as Google Analytics 4™ interface changes some of these features may stop working.
Quick Access to Settings: Most features can be toggled on/off from the popup. Features with more detailed configurations (like "Click to Copy" actions or "Date Range Presets" visibility) have a settings option in the popup. Clicking this will open a dedicated settings page.
Looking for a Quick Overview? Visit our features page for a concise summary of all capabilities.
1. Click to Copy Cell
Applies to: Explorations & Standard Reports
Quickly copy values from table
cells, headers, or dimension labels to your clipboard. Detailed click behaviors (single, double,
triple) can be
configured by clicking the Settings button in the popup.
- Single Click (if enabled): Copies the text of the specific line you clicked within a cell.
- Double Click (Explorations Only, if enabled): Copies the entire text content of the clicked cell or label, automatically adding spaces where lines wrap.
- Triple Click (Exploration Data Cells Only, if enabled): Copies the combined text content from the hover tooltip.
2. Sticky Report Header
Applies to: Standard Reports Only
Keeps the header row visible while
scrolling, making it easier to analyze long reports without losing track of metric columns.
- When scrolling down a long table in a Standard Report it's hard to know which metric you're looking at. This feature keeps the header row fixed at the top.
- NEW: The search box and pagination controls are now sticky to the bottom when scrolling for easy access. There is an option in the settings to turn this off if needed.
3. Highlight Sampling
Applies to: Explorations & Standard Reports
Instantly see when your data is
sampled. This feature makes the data quality icon pulse so you're always aware of potential data
inaccuracies.
4. Percentage Change Highlighter
Applies to: Standard Reports Only (when date comparison is active)
Uses
conditional formatting to highlight significant positive or negative trends based on
user-defined ranges and colors. Configure ranges, colors, and highlight source in settings.
5. Δ% Share Change (Reports)
Applies to: Standard Reports Only (when date comparison is active)
Calculates
and displays the percentage change of the "percentage of total" values directly in the "%
change" row, providing deeper context than standard % change.
(XX.XX%)) generated by GA4 in the data rows. If these are missing or GA4
changes their structure, this feature may not work.
6. Percentage of Column Total
Applies to: Explorations Only
On hover, this instantly calculates each row's
percentage contribution to the column total, ideal for quick contribution analysis.
7. Detailed Results Shortcut (Beta)
Applies to: Explorations Only
Manually trigger "More detailed results" (less
sampling) in Explorations using a keyboard shortcut for better accuracy. Configure manual or
automatic activation modes in settings.
- Keyboard Shortcut: Press Ctrl+Shift+Q (Windows/Linux) or Command+Shift+Q (Mac) while on an Exploration page.
- When to Use: Use this when you see a sampling icon (⚠️) in your Exploration, indicating that the data is sampled.
- What it Does: Attempts to switch the Exploration to use "More detailed results" which provides less sampled data.
8. Percentage of All Users
Applies to: Explorations Only
Quickly calculate and compare user conversion
rates for different segments against the total user base, simplifying funnel and segment
performance analysis.
9. AB Test Segment Comparison
Applies to: Explorations Only
A powerful tool for conversion rate
optimization (CRO) that compares metrics between test variations, calculates statistical
significance, and checks for sample ratio mismatch (SRM).
How it Works
- Automatic Activation: The moment your Exploration contains correctly named segments, the feature activates automatically.
- At-a-Glance Icons: The feature places minimalist arrow icons directly inside the cells of your variant segments.
- Visibility Toggle: A new 'eye' icon appears in the top-right of the GA4 interface.
- Detailed Hover Tooltip: Hovering over any cell provides detailed tooltip with exact percentage differences and statistical significance.
10. Exploration View Enhancer
Applies to: Freeform Explorations Only
A comprehensive suite of tools designed to maximize your productivity when working with GA4 Freeform Explorations. Combines three powerful sub-features: Collapsible Panels for screen real estate, Maximize View for instant data density optimization, and Pagination Controls for effortless navigation through large datasets. Additionally, hover over exploration tabs to see full tab names when they're truncated.
10a. Collapsible Panels
Adds toggle buttons to collapse/expand the "Variables" and "Tab Settings" panels in Explorations, giving you maximum screen real estate for your data table.
- Chevron buttons appear on the left side of the Exploration table to minimize/expand the Variables and Settings panels.
- Collapsed panels stay collapsed as you navigate between Explorations (optional setting).
- Provides more horizontal space for viewing wide tables with many columns.
10b. Maximize View
Instantly optimize your Exploration view to display the maximum amount of data with a single click or keyboard shortcut. Automatically sets "Show rows" to 500 and "Show column groups" to 20.
- One-Click Activation: Click the "Maximize View" button that appears in your Exploration interface.
- Keyboard Shortcut: Press Shift+M to instantly maximize your view.
- Smart Panel Handling: If the Settings panel is collapsed, Maximize View automatically expands it, applies the changes, and optionally re-collapses it.
- Auto-Maximize Option: Enable "Auto-maximize on load" to automatically apply Maximize View whenever you open a Freeform Exploration.
- Tab Tooltips: Hover over exploration tabs to see full tab names when they're truncated.
10c. Pagination Controls
Navigate through large datasets effortlessly with an intelligent pagination system that overlays intuitive controls on your Exploration canvas.
- Floating Pagination Bar: A sleek pagination bar appears at the bottom-center of your Exploration table, showing your current position (e.g., "Rows 1-500") with navigation controls.
- Next / Previous Buttons: Advance or return through row sets without opening the Settings panel.
- Rows Per Page Dropdown: Quickly change how many rows to display (10, 25, 50, 100, 250, or 500).
- Keyboard Shortcuts:
- Alt+→: Navigate to next page
- Alt+←: Navigate to previous page
- Alt+Home: Jump to first page
- Alt+End: Jump to last page (when detectable)
11. Sticky Conversion Calculator
Applies to: All Google Analytics 4™ Pages
A quick-access calculator for
common marketing calculations like conversion rate or CPC, available anywhere in the GA4
interface. Calculate two CRs and compare them with absolute difference and relative uplift.
- A calculator icon appears in the bottom-right. Click to open.
- Calculate two CRs (CR1, CR2) by entering Conversions and Total.
- Compares CR2 vs CR1 (Absolute Difference, Relative Uplift).
- Panel header is draggable. Click icon or "X" to close.
12. Date Range Presets
Applies to: Standard Reports Only
Adds quick-select buttons for common date ranges (e.g., 7D, 30D, LM) and comparisons (e.g., LM MoM), plus a powerful Compare button with three comparison modes for instant, accurate date comparisons. Customize visible presets and their order by clicking the Settings button in the popup, or by clicking the gear icon next to the presets on the GA4 page.
- Preset buttons appear next to the date picker in Standard Reports.
- Clicking a preset applies it and reloads the report.
- If many presets are visible, a scrollbar appears in the preset area.
- Comparison presets are hidden on Advertising pages.
- Compare Button — Three Powerful Modes: A dedicated Compare button appears alongside the presets with three distinct comparison modes:
- Click (no modifiers): Applies "vs. Previous Period" comparison with weekday alignment for accurate period-to-period analysis.
- Shift + Click: Applies "vs. Last Year" comparison using exact calendar dates for simple year-over-year analysis.
- Ctrl + Shift + Click (Cmd + Shift on Mac): Applies "vs. Last Year (Day of Week Aligned)" for the most accurate year-over-year comparison that accounts for weekday shifts.
- Smart Override: Clicking with any modifier key instantly switches to that comparison mode, even if another is already active.
- Toggle Off: Clicking the same mode again removes the comparison entirely.
13. Quick Calculated Metric
Applies to: Standard Reports & Explorations (Table Visualization)
Create calculated metrics (rates, ratios) directly in your reports without using GA4 Admin settings. Save to your library for reuse across reports. NEW: Right-click segment headers in Freeform Explorations to compare all metrics across segments instantly!
In Standard Reports
Adds a new column to your report table for calculated rates.
- Click + Add calculated rate in the new column header.
- Select numerator and denominator metrics from dropdowns.
- Choose display format (Percentage or Decimal).
- Optionally save to library and set auto-apply preferences.
- Use the pencil icon to edit, plus (+) icon to add more columns. Manage saved rates in Settings → Global Features.
In Freeform Explorations (Table Only)
Calculated rates appear in hover tooltips. Create them by right-clicking metric or segment headers.
- Metric-Based Calculations — Best for conversion rates, engagement rates (e.g., Conversions ÷ Sessions): Right-click a metric header, select "Create from '[Metric Name]'...", choose denominator and format.
- Segment-Based Calculations (NEW) — Best for segment penetration, cohort analysis (e.g., Mobile Users ÷ All Users): Right-click a segment header, select "Create rate from '[Segment Name]'...", choose denominator segment. Calculation applies to all metrics in that segment.
- Saved metrics auto-apply when their numerator and denominator are present. Manage all saved calculations in Settings → Global Features.
14. Line Chart Color Customization (Beta)
Applies to: Standard Reports & Explorations
Customize the colors of line
charts and add hourly granularity to Standard Reports. Click the palette icon near charts to
customize colors, or use the new "Hour" option in the time interval dropdown for detailed hourly
analysis.
15. Fix Shared Links
Applies to: All Google Analytics 4™ Pages
Shared GA4 links often open with a "Missing permissions" error or are redirected to the welcome page — not because you don't have access, but because the link opened under the wrong Google account. This feature detects that situation and automatically finds the right account for you.
How it Works
- When GA4 shows a "Missing permissions" error or redirects to the Welcome to Google Analytics page, the extension detects it automatically.
- It allows you to scan all your signed-in Google accounts to find which one has access.
- Once it finds an account with access, it opens the previously attempted link under that account.
- Share the extension with your stakeholders to prevent them from complaining that they can't access your links!
Smart Share Link Button
This feature also adds a "Copy smart share link" button to the GA4 Optimizer toolbar on Standard Reports, Advertising, and Explorations pages.
- Auto-Cleans the URL: Automatically strips the
?authuser=parameter that GA4 adds to URLs, which can force recipients into the wrong Google account and cause instant "Missing permissions" errors. - Includes a Helpful Note: Along with the clean URL, the clipboard text includes a short professional note with a link to the extension, giving your client an instant lifeline if they get stuck.
- Exploration Workflows: If an Exploration hasn't been shared natively yet, the button first triggers GA4's native share flow, then copies the clean URL and note to your clipboard.
16. Create Exit Pages Report
Applies to: All Google Analytics 4™ Pages (via Popup)
Instantly generates a
new Standard Report template pre-filled with Exits, Views, and
Bounce Rate metrics, using Page Path as the primary dimension. This feature
provides a crucial workaround, as the "Exits" metric is not available in the standard GA4 Report
Builder UI.
- How it works: When you are on any GA4 property page, open the extension popup, navigate to the "Reports" tab, and click the "Create Exit Pages Report" button.
- Your current tab will be redirected to the GA4 "Create a new report" screen, with the necessary (and normally unavailable) metrics and dimensions already selected for you.
- You can then save this report to your library for future use. The Exit Rate column will automatically appear thanks to the calculated metric.
17. Custom Definitions Copy/Paste
Applies to: GA4 Admin > Custom Definitions Page Only
Copy custom dimensions, custom metrics, and calculated metrics between GA4 properties. Perfect for setting up new properties, migrating configurations, or maintaining consistency across multiple properties.
How to Use
- Copy from Source Property:
- Go to Admin > Custom definitions in your source property.
- Click the tab for what you want to copy (Custom dimensions, Custom metrics, or Calculated metrics).
- Click the "Copy [Type]" button with the GA4 Optimizer logo.
- Wait for "Copy completed successfully" message.
- Paste to Destination Property:
- Go to Admin > Custom definitions in your destination property.
- Click the matching tab for what you copied.
- Click "Paste [Type]" button (shows how many items are available).
- Review what will be created and click "Continue".
Key Features
- Smart Duplicate Prevention: Automatically skips items that already exist.
- Multi-Type Clipboard: Copy dimensions, metrics, and calculated metrics separately — the system remembers all of them.
- Progress Tracking: Shows real-time progress with option to cancel long operations.
- Handles Large Datasets: Works with hundreds of items across multiple pages.
18. 500 Rows per Page
Applies to: Standard Reports Only
GA4's "Rows per page" dropdown maxes out at 250 by default. This feature adds a 500 option so you can see twice as many rows without paginating — ideal for large reports where you need the full picture at a glance.
- Open any Standard Report and scroll to the bottom of the table.
- Click the Rows per page dropdown — you'll see a new 500 option with the GA4 Optimizer icon next to it.
- Select it. The page reloads with 500 rows displayed.
- A confirmation toast appears at the bottom of the screen reminding you that larger row counts may slow the page down.
19. Date Range Override NEW
Applies to: Read-Only Shared Explorations
When someone shares a read-only Exploration with you, GA4 locks the date range — you can see the data, but you can't change the time period. Date Range Override breaks that restriction, letting you query any date range you need without asking the owner to re-share.
- On any read-only Exploration, an Edit Date button appears below the date range in the Variables panel.
- Click it, pick your new start and end dates, and hit Apply & Reload. The page reloads and GA4 fetches fresh data for your chosen range.
- The date label turns purple to signal that an override is active, and a Clear button appears so you can instantly revert to the original dates.
- Works on all Exploration types: Free Form, Funnel, Path, Segment Overlap, Cohort, and more.
Comparison Date Range
If the shared Exploration already has a date comparison active (e.g., "Compare: Mar 27 – Apr 9, 2026"), the Edit Date modal automatically shows a second set of fields for the comparison period. Change both ranges in one step and reload once.
20. Advanced Table Filter (Beta)
Applies to: Standard Reports Only
Brings back Universal Analytics-style advanced filtering to GA4 Standard Reports. Set conditions like "Views > 10,000" or "Page path contains /shop" and GA4 returns only the rows that match. Combine multiple conditions with AND logic for precise data slicing.
- Where to find it: Look for the "Advanced" button in the table controls bar, next to Search and Rows per page.
- Metric filters: Filter by count metrics (Views, Active users, Events, Key events, Revenue, etc.) using greater than, less than, or equals.
- Dimension filters: Filter by dimensions (Page path, Event name, Source/medium, etc.) using contains, exactly matches, begins with, ends with, regex, and their negated versions.
- Multiple conditions: Stack as many rules as you need. They combine with AND logic.
- Smart value handling: Revenue metrics automatically convert to the correct internal format. Rate metrics (bounce rate, CTR, conversion rate) accept percentage values directly. Type "20" for 20%.
21. Annotations in Explorations (Beta) NEW
Applies to: Explorations (all techniques)
GA4 shows annotations on Standard Report line charts but completely strips them from Explorations. This feature brings your annotations back so you always have context for data spikes and drops, regardless of which report type you're using.
- Line chart dots: On Explorations with a line chart, colored dots appear along the x-axis at the dates where annotations exist. Hover a dot to see the annotation title and description.
- Toolbar button: On any Exploration (table, funnel, path, cohort, etc.), an Annotations icon appears in the GA4 Optimizer toolbar. Click it to open a scrollable list of all annotations for the property, sorted newest first.
- Color-coded: Each annotation uses the same color you assigned in GA4's Standard Reports. The color appears on the chart dots, in the hover tooltip, and as a left-border accent in the full list.
- Color labels: In Settings (Explorations tab), you can give each of the six annotation colors a custom label (e.g., "GTM Updates", "Campaigns", "Incidents"). These labels show up when hovering color indicators and next to dates in the full list.
- Same-date grouping: If multiple annotations share the same date, they appear as a single dot. The hover tooltip lists all of them with a separator between each entry.
22. Team Sync & Sharing NEW
Applies to: Extension Settings Page (Global tab)
Share your GA4 Optimizer configuration with teammates so everyone runs the same setup. No backend, no accounts needed.
- Export: Choose which settings to include (Calculated Metrics, Annotation Labels, PCH Ranges), then download a .JSON file or copy a shareable code.
- Import: Paste a code, upload a file, or connect a hosted URL. Imported metrics merge with your existing library (matching IDs update, new ones are appended).
- Per-metric sharing: Each Calculated Metric has a share button that copies just that one metric as a code your teammate can paste in.
- Auto-sync: Connect a team URL once and the extension silently checks for updates on startup.
23. Data Dictionary NEW
Applies to: Standard Reports, Explorations, Overview Snapshot Cards, and Dimension/Metric Pickers
The Data Dictionary surfaces your tracking plan definitions as tooltips directly inside GA4. Define your custom events, dimensions, and metrics once, and every team member sees those definitions right next to the data, without switching to a spreadsheet or wiki.
How It Works
- Hover tooltips: A small info icon appears next to event names in table rows, dimension headers, metric headers, and overview snapshot cards. Hover to see the definition instantly.
- Inline editing: Click the icon to add or update a definition without leaving the GA4 report. Changes save immediately.
- Scope Cascade: Definitions resolve in priority order: Property, then Account, then Global. Agencies can set global defaults while individual properties override with specific context.
- Pre-loaded defaults: Ships with 80+ standard GA4 event definitions and 40+ dimension definitions out of the box, so your team gets value on day one.
- Works everywhere: Icons appear in Standard Report tables, Exploration tables, overview page snapshot cards, and the Exploration dimension/metric picker (under the "Custom" category).
- Dimension picker tooltips: When selecting dimensions or metrics in Explorations, custom items under the "Custom" category show the info icon on hover. This helps you remember what each custom dimension means before adding it to your report.
Team Collaboration
- CSV Import: Bulk-import your tracking plan from a spreadsheet. Supports the 4-column format: Scope, Type (event/dimension/metric), Name, Description.
- Google Sheets Auto-Sync: Paste a Google Sheets "Publish to Web" CSV link and the dictionary syncs automatically in the background. When your team updates the master sheet, every browser picks up the changes within an hour.
- Governance: Definitions imported via Auto-Sync are locked (read-only in the GA4 UI). Manually added definitions remain fully editable.
- Stale entry cleanup: If a row is removed from the source spreadsheet, the next background sync automatically removes it from the local dictionary.
- CSV Export: Export your entire dictionary as a CSV for backup or sharing with teammates who have not installed the extension yet.
- Team Sync JSON: The dictionary is also included in the Team Sync JSON export/import bundle as an option (Settings > Team & Sync tab).
Settings
- Where to configure: Open the extension Settings page and navigate to the "Data Libraries" tab, then scroll to the "Data Dictionary" card.
- Filter tabs: Use the All / Events / Dimensions / Metrics tabs to quickly find what you are looking for.
- Search: Type to filter definitions by name or description. The search field appears when you have more than 10 entries.
- Bulk actions: Select multiple entries with checkboxes, then delete them in one click.
- Restore Defaults: Click "Restore GA4 Defaults" to re-add the standard GA4 definitions without affecting your custom entries.
24. Exact Numbers on Hover BETA
Applies to: GA4 Home Screen & Reports Hub Overview Cards
GA4 abbreviates large numbers on the Home screen (e.g., "24K", "2.4M"). Hover over any abbreviated metric to see the full exact number pulled directly from the API response.
- A purple dashed underline indicates which numbers are hoverable.
- On hover, the exact value appears in purple (e.g., "24K" becomes "24,390").
- Move your mouse away and the original abbreviated value returns.
- Data updates automatically when you change the date range.
25. Bulk Annotations NEW
Applies to: GA4 Admin > Annotations Page & Native Annotation Panel
Save hours of manual data entry by creating annotations across dozens of properties at once. Supports both manual entry and CSV import of GA4's native annotation export. Perfect for logging algorithm updates, site redesigns, or marketing campaigns across your entire organization.
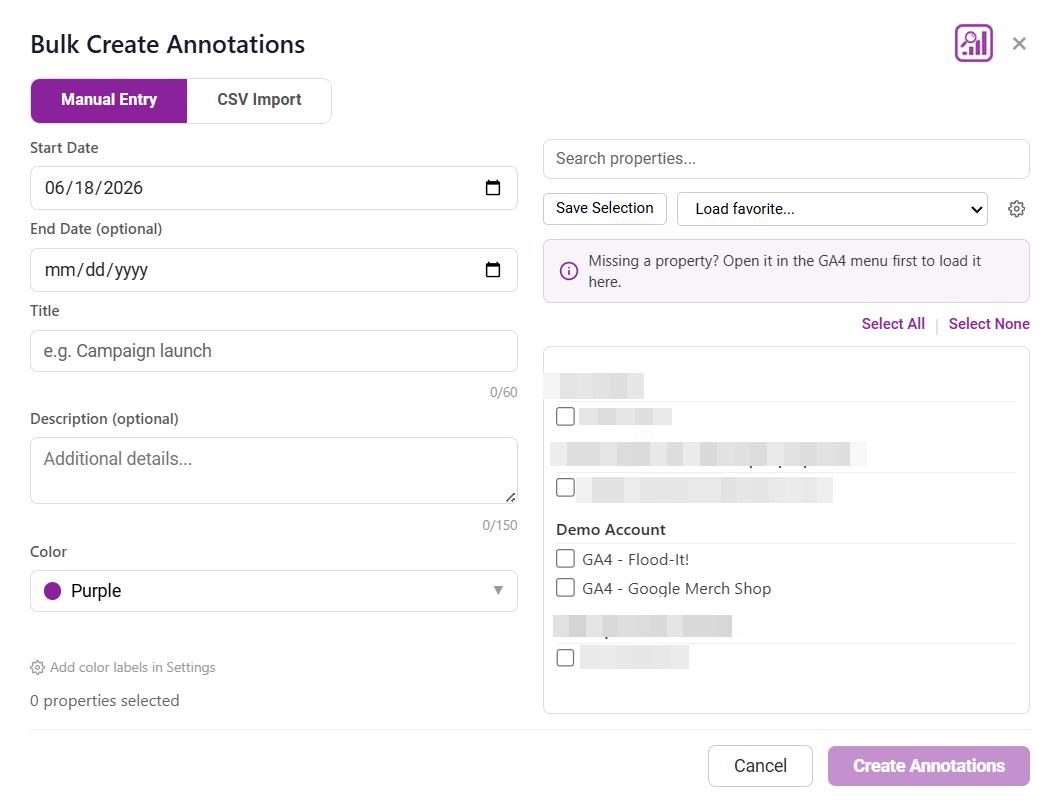
Two Ways to Create
- Manual Entry: Set a start date (and optional end date for date ranges), title, description, and color. Then select which properties should receive the annotation.
- CSV Import: Export annotations from one GA4 property using GA4's native export, then import that CSV file to replicate those annotations across other properties. The importer validates the file format and shows a preview before you commit.
How to Use
- Open the Tool: Click the purple "Bulk Create" button on the Admin Annotations page, or look for the "Bulk Create" button inside GA4's native annotation creation panel on any report page.
- Toggle Mode: Switch between "Manual Entry" and "CSV Import" using the toggle at the top of the modal.
- Select Properties: Check the boxes for the properties you want to apply annotations to. Sub-properties and rollups are indented under their parent accounts.
- Save Favorites: Frequently annotate the same group of properties? Use "Save Selection" to create a named favorite list you can reload with one click.
- Submit: Click "Create Annotations" and watch the progress bar as each annotation is applied sequentially.
Date Ranges
Annotations can span a date range (start date to end date) or mark a single day. In manual mode, leave "End Date" empty for a single-day annotation. CSV imports automatically detect whether each row is a single date or a range.
Troubleshooting
Ensure you are on the correct page type (Exploration or Standard Report). Try refreshing the GA4 page using the button in the popup or your browser's refresh. Double-check the feature is toggled on in the popup.
The GA4 interface might have changed. Check for extension updates or report the issue. For "Percentage of Column Total", if "Total" row is scrolled out of view, data might be unavailable. For "Percentage of All Users" or "AB Test Segment Comparison", if 'All Users' or 'VAR-Control' columns are out of view, data may be unavailable.
Ensure feature and desired click actions are enabled in settings (by clicking the Settings button in the popup). Complex Exploration tables can be tricky; manual selection might be needed.
- Verify exploration type: This feature only works in Freeform Explorations with Table visualization.
- Check segment naming: must start with
VAR-, control withVAR-Control(case-sensitive). - Ensure variant and a matching control segment (same metric) are in the table and visible.
- Control segment's value must not be zero/non-numeric for count comparison.
- For Δ%Shr comparison, both variant and control cells need valid, non-zero column totals.
- Statistical significance requires column totals to be visible for all variants and sample sizes to be adequate (n > 30).
- General: Ensure you are on a Freeform Exploration page. This feature does not work on other exploration techniques (Funnel, Path, Cohort, etc.) or Standard Reports.
- Master Toggle: Check that "Maximize View" is enabled in the popup. Individual sub-features (Collapsible Panels, Maximize View, Pagination) also have their own toggles in the settings page.
- Collapsible Panels: If the chevron buttons are misplaced or missing, try refreshing the GA4 page.
- Maximize View: If the button doesn't appear or Shift+M doesn't work, ensure the feature is enabled and you're on a Freeform Exploration.
- Pagination: If the pagination bar doesn't appear, verify you're on a Freeform Exploration, ensure the Settings panel is expanded, and check that pagination is enabled in settings.
- Pagination Buttons Disabled: If pagination buttons are grayed out, expand the Settings panel — pagination requires access to GA4's "Start row" and "Show rows" inputs.
- Keyboard Shortcuts Not Working: Ensure you're not typing in an input field when pressing shortcuts.
- Ensure you are on a Standard Report page. Try refreshing the GA4 page.
- Check the feature is enabled and configured in settings (by clicking the Settings button in the popup).
- Visual overlaps with sticky header might occur; try toggling sticky header or refresh.
- In Standard Reports: The feature adds a new column. If it's not there, refresh the page. Both the numerator and denominator metrics must be present as columns in the report.
- In Explorations: Verify you're using Freeform technique with Table visualization. The feature will not work in other exploration types or visualizations. It works via right-clicking a metric header. Both the numerator and denominator metric columns must be present in your Exploration table for the same segment.
This can happen in Standard Reports due to how GA4 renders its charts. GA4's code can sometimes override the custom colors after a moment, most commonly when a "Total" line is included. The feature works most reliably in Explorations. If colors don't apply, try refreshing the page or toggling the "Total" series off in the GA4 report settings.
- Ensure the feature is enabled in the popup (Global tab).
- The scan only triggers when GA4 shows a "Missing permissions" error. If you already have access, nothing will appear — that's expected.
- If the scan ran but found no matching account, none of your currently signed-in Google accounts have access to that property. Use the "Log in to another account" link in the dialog to add the right account.
- If the dialog appeared but the scan didn't start automatically, try refreshing the page and opening the shared link again.
- Buttons not appearing: Ensure you're on the Admin > Custom definitions page in GA4. The feature only works on this specific admin page.
- Copy operation fails: Verify you have Editor or Administrator role on the source property and that there are items to copy on the current tab.
- Paste button disabled: Make sure you're on the correct tab for the data you copied. The paste button only enables when there's matching data for the current tab.
- Paste operation interrupted: If your computer locks or the browser becomes inactive, look for a recovery modal when you return. You can resume, start over, or cancel.
- Large datasets timing out: For properties with 50+ items, the operation may take several minutes. The system automatically prevents computer sleep on supported browsers.
- Storage quota errors: The system automatically switches to local storage for large datasets. Clear your browser's extension data if issues persist.
- Feature not enabled: Check that "500 Rows per Page" is toggled on in the popup under the Reports tab.
- Wrong page type: This feature only works on Standard Reports. It will not appear in Explorations, Admin pages, or the GA4 home screen.
- Option not visible after enabling: Close and reopen the dropdown. The option is injected when the dropdown opens, so it won't appear in a dropdown that was already open when you enabled the feature.
- Page loaded slowly: On slow connections, the option may take a moment to appear. Close and reopen the dropdown if it's missing.
- Edit Date button not appearing: This feature only activates on read-only shared Explorations. If you own the Exploration or have edit access, the button will not appear — use GA4's native date picker instead.
- Override not applying after reload: Ensure you clicked "Apply & Reload" rather than just closing the modal. The page must reload for the new date range to take effect.
- Purple date label not showing: Try refreshing the page. If the label still doesn't turn purple, the override may not have been saved correctly — open the modal and apply again.
- Comparison fields not appearing in the modal: The second set of date fields only appears if the original shared Exploration already has a comparison date range active. If there's no comparison in the original, the modal will only show the primary date range fields.
- Override disappears after closing the tab: This is expected behavior. The override is session-only and does not persist across tabs or browser sessions. Re-apply it when you reopen the link.
- Export shows wrong comparison header: This is a known GA4 limitation. The data values are correct for your overridden range, but the column header in the export reflects the original read-only dates. GA4 Optimizer will warn you about this before the export proceeds.
- Import not merging correctly: Imported metrics merge by ID. If a metric with the same ID exists, it will be updated. New metrics are appended. Check the import summary for details.
- Auto-sync URL not updating: Ensure the URL is accessible (not behind authentication) and returns valid JSON. The extension checks on startup only, so restart your browser or reload the extension to trigger a sync.
- Shareable code not working for teammate: Ensure your teammate is on the latest version of GA4 Optimizer. Older versions may not support the Team Sync format.
- Icons not showing: Ensure the Data Dictionary feature is enabled in the popup. The info icons only appear next to items that have a matching definition in your dictionary.
- Custom dimensions not matched: Definitions match by exact name (case-sensitive). Verify the name in your dictionary matches exactly what GA4 displays in the report.
- Google Sheets sync not updating: Auto-sync runs in the background approximately once per hour. To force a sync, go to Settings > Data Libraries > Data Dictionary and click the sync button manually.
- Locked definitions can't be edited: Definitions imported via Auto-Sync are read-only by design. To edit them, either update the source spreadsheet (changes sync automatically) or disconnect Auto-Sync and manually add the definition.
- No purple underline: This feature only works on the GA4 Home screen and Reports Hub overview cards. It does not apply to Standard Reports or Explorations.
- Feature not enabled: Check that "Exact Numbers on Hover" is toggled on in the popup.
- Numbers not appearing on hover: The extension captures data from GA4's API response as it loads. If you enabled the feature after the page loaded, refresh the page so the extension can intercept the API data.
- Some cards missing exact values: If GA4 did not include exact totals in its API response for a particular card, the extension cannot display them. This is uncommon but can happen with certain widget types.
- Bulk Create button not appearing: Ensure you're on the Admin > Annotations page or have the native annotation panel open on a report page. The feature must be enabled in the popup.
- Properties not showing in the list: Open each property once in the GA4 sidebar menu first. The extension discovers properties as GA4 loads them in your session.
- CSV import failing: Ensure you're using a CSV exported from GA4's native annotation export. The importer validates the file format — check that columns match the expected structure (date, title, description, color).
- Creation taking a long time: For large operations (many properties or annotations), the tool deliberately spaces out requests to avoid rate limiting. An estimated completion time is shown before you start.
- Some properties failed: Check the progress summary after completion. Failed properties may require higher access permissions (Editor or Administrator role) or may have hit GA4's annotation limits.
For questions or feedback, please visit our Contact Page.
Ready to Supercharge Your Workflow?
Get all these features and more with our free browser extension.
Add GA4 Optimizer to Chrome — It's Free