Google Tag Manager release notes are traditionally brief, but a single sentence published on November 9 quietly solved one of the most frustrating tracking issues in web analytics.
If you manage analytics for a modern, fast-loading website, you have likely noticed a discrepancy in your data. Users navigate through your site, but when they click their browser's "Back" button to return to a previous page, Google Analytics 4 often fails to record that return visit.
Google just pushed an under-the-hood update to Google Tag Manager that fixes this exact problem. Web measurement tags subscribed to history change events will now natively record pageviews when a user navigates backward or forward.
Here is why the back button breaks standard analytics tracking, how Google's new update patches the gap, and why you need to audit your setup today to prevent duplicate data.
The Problem: The "Back Button" Tracking Gap
Modern web browsers like Chrome, Safari, and Firefox are designed for speed. One of the ways they achieve instant page loads is through a feature called the back/forward cache (bfcache).
When a user visits a product page and then clicks the "Back" button to return to the category list, the browser does not request a fresh version of the category page from your server. Instead, it pulls a perfectly frozen snapshot of the page directly from its memory cache. The page loads instantly.
While this is excellent for user experience, it creates a massive blind spot for analytics.
Because the browser simply unfreezes the page, the core JavaScript environments do not reload. Traditional window.onload triggers do not execute. As a result, the Google Tag Manager container does not fire a standard pageview tag. The user successfully navigated back to your category page, but GA4 never recorded it, resulting in a silent 10 to 20 percent drop in legitimate pageview data.
Historically, analysts had to rely on complex custom JavaScript to fix this. You had to write a custom HTML listener that waited for the page to unfreeze, and then manually push a custom event into the dataLayer to force GA4 to track the view.
The Fix: Native GTM History Change Support
With the November 2026 update, Google Tag Manager is absorbing this technical burden.
GTM already relies on the History Change trigger to track pageviews on Single Page Applications (SPAs). When a React or Vue website changes the URL without reloading the page, the History Change trigger catches the shift and fires the GA4 tag.
Now, Google has updated the underlying logic of these history events. Tags that rely on history changes will automatically mirror their behavior when a page is restored from the browser's memory cache.
When a user clicks the back button and the browser unfreezes the previous page, GTM will detect the cache restoration and trigger the appropriate history change event natively. Your GA4 configuration tag will fire, the pageview will be recorded, and your tracking gap is closed.
Action Required: How to Audit Your Setup
Depending on how your SPA tracking is configured, this background update requires a quick audit of your setup to ensure data accuracy.
Scenario A: You Rely on GA4 Enhanced Measurement
If you rely on GA4 to track history changes automatically, you must ensure the setting is actually enabled to take advantage of this update.
- Navigate to your GA4 Admin panel.
- Go to Data Streams and select your active web stream.
- Click the gear icon in the Enhanced Measurement section.
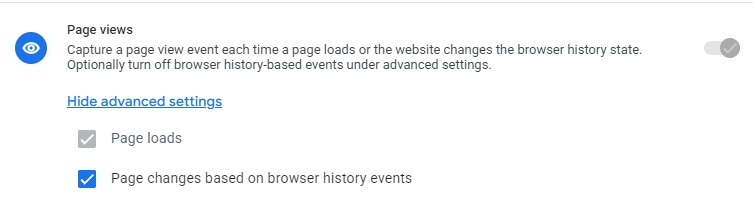
- Click "Show advanced settings" under the Page views section.
- Ensure the box for "Page changes based on browser history events" is checked.
Scenario B: You Use Custom GTM History Triggers (Warning)
Many advanced analysts turn off the GA4 Enhanced Measurement setting because it can be buggy, opting instead to build custom GTM History Change triggers.
If you previously built a custom JavaScript workaround to force tracking on bfcache restorations, and GTM is now handling it natively, you are at high risk of double-firing your tags. You will need to audit your container and remove your legacy custom HTML listeners, or your pageview metrics will artificially inflate.
Validate Your SPA Tracking Locally
Single Page Applications are notoriously difficult to track accurately. Whether you are checking for newly created duplicate pageviews or ensuring your history triggers fire at the exact right moment, you need a tool capable of diagnosing these timing issues in real time.
Install the free GA4 Live Debugger Chrome extension. Built by the GA4 Optimizer team, this debugging workspace runs locally in your browser and explicitly monitors SPA health.
When you navigate your website, the debugger traces every dataLayer push directly to its resulting GA4 network hit. It automatically flags "Duplicate Pageviews" if your custom GTM setup conflicts with GA4's Enhanced Measurement. It also flags "Stale URLs" if your tag fires before your website router successfully updates the document path.
Stop guessing if your history change triggers are firing correctly. Use the GA4 Live Debugger to validate your payloads instantly.