

When analyzing data in Google Analytics 4, having a complete view of your metrics is critical. If you are auditing landing page performance or reviewing campaign source traffic, you want to see as much data as possible on a single screen. However, Google restricts standard reports to a maximum of 250 rows per page.
If you have hundreds of active campaigns or thousands of pages, this limit forces you to click through endless pages of data or export everything to a spreadsheet just to skim your top performers.
Here is how you can bypass this limitation and view up to 500 rows per page directly inside the GA4 interface.
The Problem with GA4's 250 Row Limit
By default, the GA4 standard report interface lets you choose between 10, 25, 50, 100, or 250 rows per page. While 250 rows might sound like enough for a quick glance, it falls short for deep analysis. Paginating through data makes it difficult to quickly scan for anomalies or compare a mid-tier performer on page three to a top performer on page one.
The traditional workaround is exporting your report to Google Sheets or Excel. But exporting takes you out of the platform. If you realize you need to adjust a filter or add a secondary dimension, you have to start the export process all over again.
How to Unlock 500 Rows per Page in GA4
To keep analysts in their workflow, we built a 500-row override directly into the GA4 Optimizer browser extension. This feature seamlessly injects a new option into the native GA4 interface.
Step-by-Step Instructions
Here is how to use it:
- Open any Standard Report in your GA4 property.
- Scroll to the very bottom of your data table.
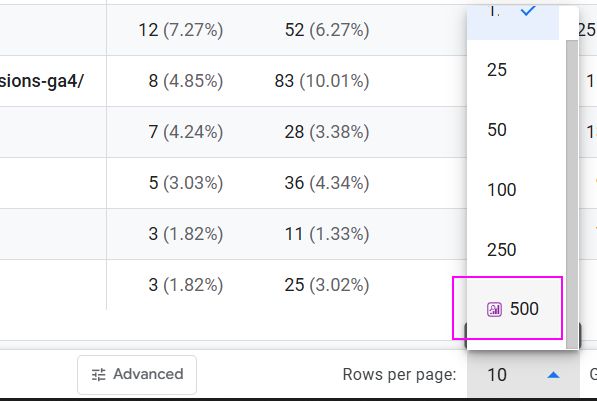
- Click the "Rows per page" dropdown menu.
- Select the new "500" option located at the bottom of the list.
The page will reload and display double the maximum amount of data natively allowed by Google.
Important Warnings: Speed and Stability
While seeing 500 rows is incredibly useful, there is a reason Google capped the limit at 250. Rendering this much data in the browser takes a significant toll on your computer hardware and GA4's processing capabilities.
Because Google Analytics does not officially support a 500-row view, you need to keep two major caveats in mind before using it.
Expect Slower Load Times
When you select 500 rows, the page will likely take a few extra seconds to load. You may also notice scrolling becomes slightly less responsive depending on your machine. This is normal behavior when pushing the interface past its intended limits.
Avoid Using Date Comparisons with 500 Rows
If you attempt to load 500 rows while comparing month-over-month or year-over-year data, GA4 is forced to calculate and render thousands of individual data points and percentage changes simultaneously. Doing this will almost certainly make the page unstable, cause the table to become unresponsive. However, we enabled this option as power users are willing to wait a bit longer to see 500 rows at once.
For a smoother experience with date comparisons, consider using 1-click date range presets at the default row count, where the Percentage Change Highlighter can flag significant trends without the stability risk.
Stop Clicking Next Page
When used carefully for single-date-range analysis, the 500-row limit increase is a massive time saver for scanning large datasets without exporting.
You can access this feature today, along with sticky table headers and on-the-fly calculated metrics, by installing the free GA4 Optimizer extension from the Chrome Web Store.
If you need to narrow down those 500 rows to a specific subset, the Advanced Table Filter lets you set conditions like "Views > 1,000" or "Page path contains /shop" directly in the report without exporting.
Frequently Asked Questions
How do I show more than 250 rows in GA4 standard reports?
By default, Google Analytics 4 limits standard reports to 250 rows per page. To view up to 500 rows, you can use the free GA4 Optimizer browser extension, which adds a 500-row option directly to the native rows per page dropdown menu.
Why does my GA4 report freeze or slow down when showing 500 rows?
Google does not officially support rendering 500 rows in a standard report. Forcing the browser to load and display this much data requires significant memory. If you use date comparisons while viewing 500 rows, the page will likely become unstable or crash.
Does the 500 rows per page limit work in GA4 Explorations?
No, the 500 rows per page dropdown addition is specifically designed for Standard Reports. For GA4 Explorations, you can use the Maximize View feature to instantly optimize the table density.