Verifying your tracking setup is a mandatory step before launching any campaign. If your ecommerce events or custom dimensions fail to fire, you lose the ability to measure ROI.
Google Tag Assistant is the primary diagnostic tool provided by Google for troubleshooting your implementation. It connects directly to your live website and reports back which tags fired and what data they captured.
Following the deprecation of the Google Analytics Debugger extension, Google consolidated its testing tools. They pushed all debugging workflows directly into the Tag Assistant platform. Here is how to use the interface to debug Google Analytics 4 (GA4), how to activate the new verbose logging feature, and why you might want a more focused tool for daily analytics work.
How to Connect Tag Assistant to Your Website
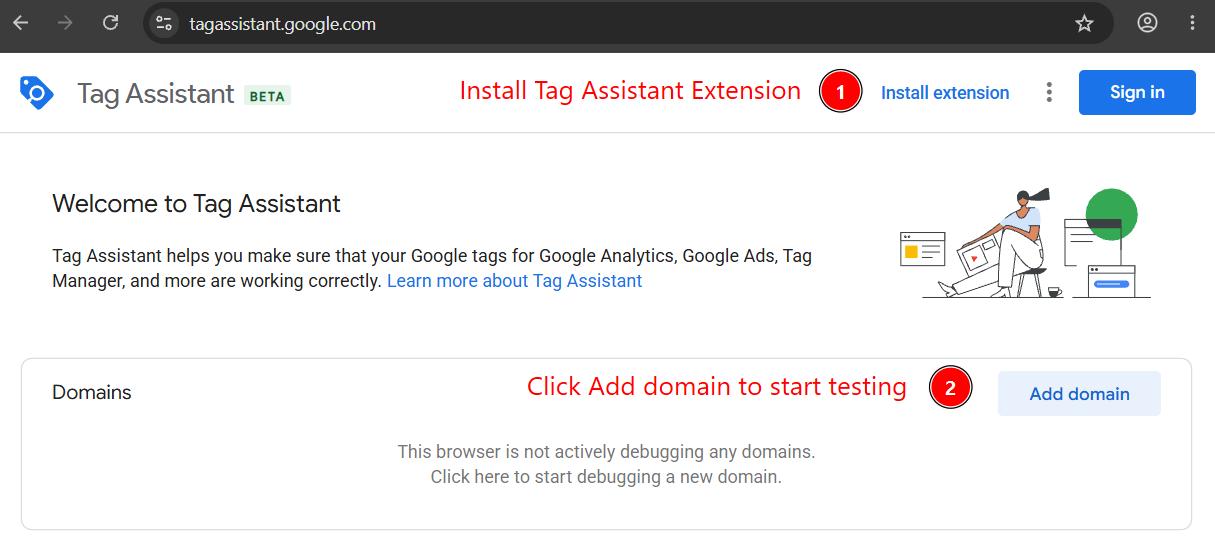
You do not strictly need to install software to use Tag Assistant, as it runs in the cloud. However, we highly recommend installing the official Tag Assistant Chrome extension.
The extension simplifies the testing process. It allows you to access the debugger in a companion side panel and keeps your website preview in a standard new tab instead of forcing open a detached browser window.
Step-by-Step Instructions
- Open a new browser tab and navigate to
tagassistant.google.com. - Click the Add Domain button in the center of the screen.
- Enter the full URL of the website you want to test.
- Check the box labeled Include debug signal in the URL. This ensures your test hits populate in the GA4 DebugView interface.
- Click Connect.
A new tab will open loading your website. You will see a small "Tag Assistant Connected" badge in the bottom right corner of the screen. Keep this tab open. Switch back to your original Tag Assistant tab to view the live diagnostic feed.
How to View GA4 Hits in Tag Assistant
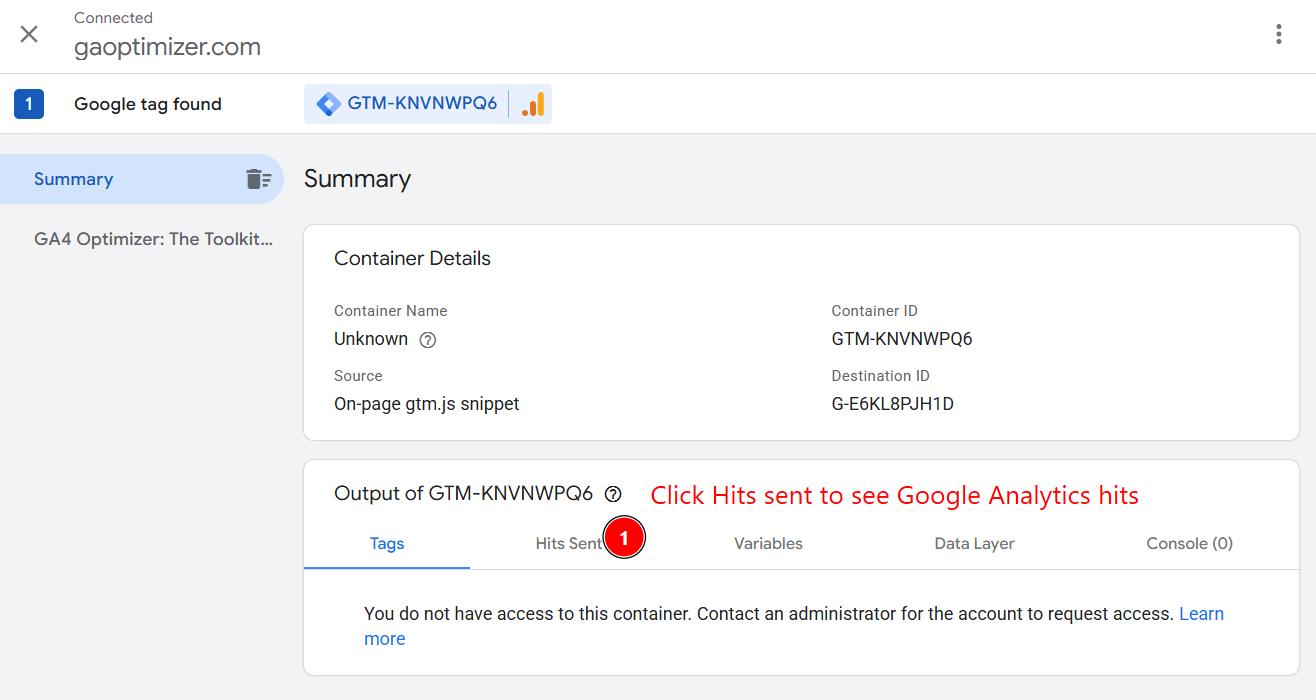
When the Tag Assistant dashboard initially loads, the interface can be confusing. If you have admin access to the Google Tag Manager (GTM) container on the site, you will see a list of GTM tags. If you do not have access, you will see a prominent warning stating "You do not have access to this container."
You can ignore this warning. You do not need GTM access to test GA4.
To see your Google Analytics requests, you must click the Hits Sent tab in the top navigation menu.
Once you open this tab, switch back to your connected website preview. Click a button, trigger a custom event, or complete a test checkout.
When you return to Tag Assistant, you will see those new events populate in the feed. You can click on any individual hit (like a "Page View") to open a detailed panel showing the exact parameters sent to Google.
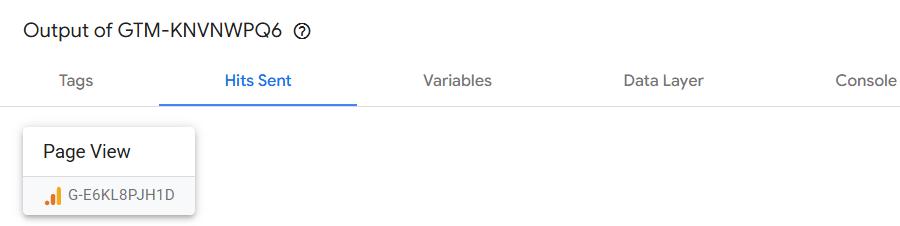
Because you checked the "Include debug signal" box during setup, these hits also bypass standard processing delays. You can open your GA4 property, navigate to Admin, and click DebugView to watch your events arrive on the timeline in real time.
Using the New Verbose Logging Feature
When Google retired the old GA Debugger extension, they moved its functionality into Tag Assistant via a new setting.
If you want to read raw system logs or inspect exact parameter payloads, you need to activate the verbose logging checkbox before you connect your domain.
When you enter your URL in the connection prompt, look for the secondary checkbox labeled Enable verbose logging. Checking this box activates a new "Console" tab inside the Tag Assistant dashboard.
As you click around your website, this console tab fills with raw text logs detailing every gtag command execution. You can use the built-in search bar to filter for specific text strings like transaction_id or currency to confirm your dataLayer parameters are passing correctly.
The Problem with Tag Assistant for GA4
Tag Assistant is highly capable, but it is built for container-wide management. If you only want to test a GA4 implementation, using this tool is incredibly inefficient.
When you connect a website, Tag Assistant captures absolutely everything. It monitors every single tag in your Google Tag Manager workspace. Your GA4 pageview events get buried underneath Google Ads remarketing tags, Floodlight configurations, and custom HTML snippets. Finding the exact GA4 hit you want to inspect requires clicking through multiple layers of container noise.
The new verbose logging tab suffers from similar usability issues. It lacks color coding and timestamps. When you test complex tracking setups, you need to know exactly when a dataLayer push fired relative to a pageview. The flat text logs in Tag Assistant make timing diagnostics nearly impossible.
A Better Alternative: GA4 Live Debugger
If you want to debug Google Analytics without digging through Google Ads and GTM clutter, you need a specialized tool.
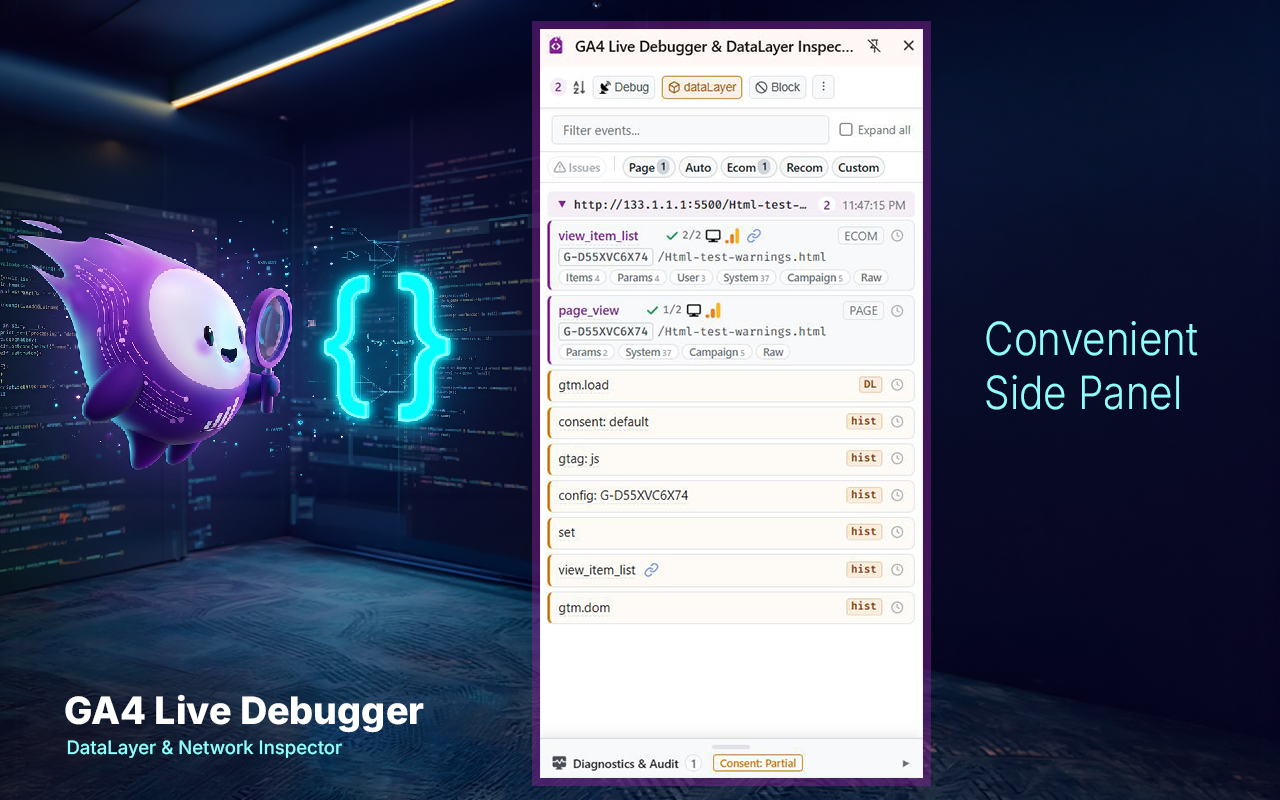
The GA4 Live Debugger is a free browser extension that brings structured tracking visibility directly into your Chrome Side Panel. It filters out the noise and focuses entirely on your GA4 network requests and dataLayer pushes.

Test Faster with GA4 Live Debugger: Stop sifting through messy container logs. Inspect GA4 payloads, validate ecommerce schemas, and block test traffic in one click.
Get the Free ExtensionUnlike Tag Assistant, GA4 Live Debugger presents your data in a clean, timestamped table. Every event is color-coded. You can instantly see if a hit was routed client-side or sent through a Server-Side GTM endpoint.
It also actively audits your work. If you fire a purchase event without a transaction ID or currency code, the extension flags an inline error immediately. You catch broken ecommerce payloads before they ever reach your reporting dashboard.
For routine analytics testing, skip the heavy Tag Assistant cloud interface and use a local Side Panel tool built specifically for the GA4 architecture.
Frequently Asked Questions
How do I connect Google Tag Assistant to my website?
Navigate to tagassistant.google.com, click Add Domain, enter your website URL, and click Connect. A new tab will open with your website, and a debugger panel will appear showing connected tags.
What is verbose logging in Google Tag Assistant?
Verbose logging is a new feature in Tag Assistant that outputs raw system logs, console messages, and tag execution details directly into the Tag Assistant interface for advanced troubleshooting.
Why is Google Tag Assistant so cluttered when debugging GA4?
Tag Assistant captures all activity from your Google Tag Manager container. It mixes GA4 events with Google Ads, Floodlight, and custom HTML tags, making it difficult to isolate specific Google Analytics payloads.