
Google has quietly begun rolling out a highly requested update to Google Analytics 4. The Realtime report, historically capped at a strict 30-minute window, is being extended up to 4 hours.
This update is progressively making its way into GA4 properties and fundamentally changes how marketers can monitor website performance during critical windows.
If you have struggled with the standard 24 to 48-hour data processing delays in GA4, this expanded timeframe offers a much-needed bridge for same-day reporting. Here is why this update matters, how to find the new timeframe settings, and the technical reason why you still will not see the "Sessions" metric in this view.
Bridging the GA4 Data Freshness Gap
One of the most persistent frustrations with GA4 is data freshness. In standard reports, it can take up to 48 hours for data to fully process and appear. If you launch a morning email campaign, you often have to wait until the next day to measure its true impact.
The previous 30-minute Realtime window was too short to draw meaningful conclusions. By extending the window to 4 hours, Google is giving marketing teams the ability to measure a half-day of performance. You can now monitor morning traffic spikes, potentially verify that conversion events are firing properly, and catch early trends before wasting an entire day of ad spend.
How to Find the 4-Hour Realtime Report
The new extended timeframes are accessible directly within the standard reporting interface, but you have to know where to look to change the default settings. Note that early rollouts of this feature have been spotted specifically on the "Realtime pages" report, and it remains to be seen if the timeframe toggle will apply to every widget on the broader "Realtime overview" dashboard. (Please note that there has been a delay to the deploayment of this feature and most analytics community has not reported seeing this feature live yet since one of the product managers has teased it.)
Step-by-Step Instructions
- Log in to your Google Analytics 4 property.
- Click the Reports icon (the graph symbol) in the left side navigation panel.
- In the secondary menu under Reports snapshot, click on Realtime pages.
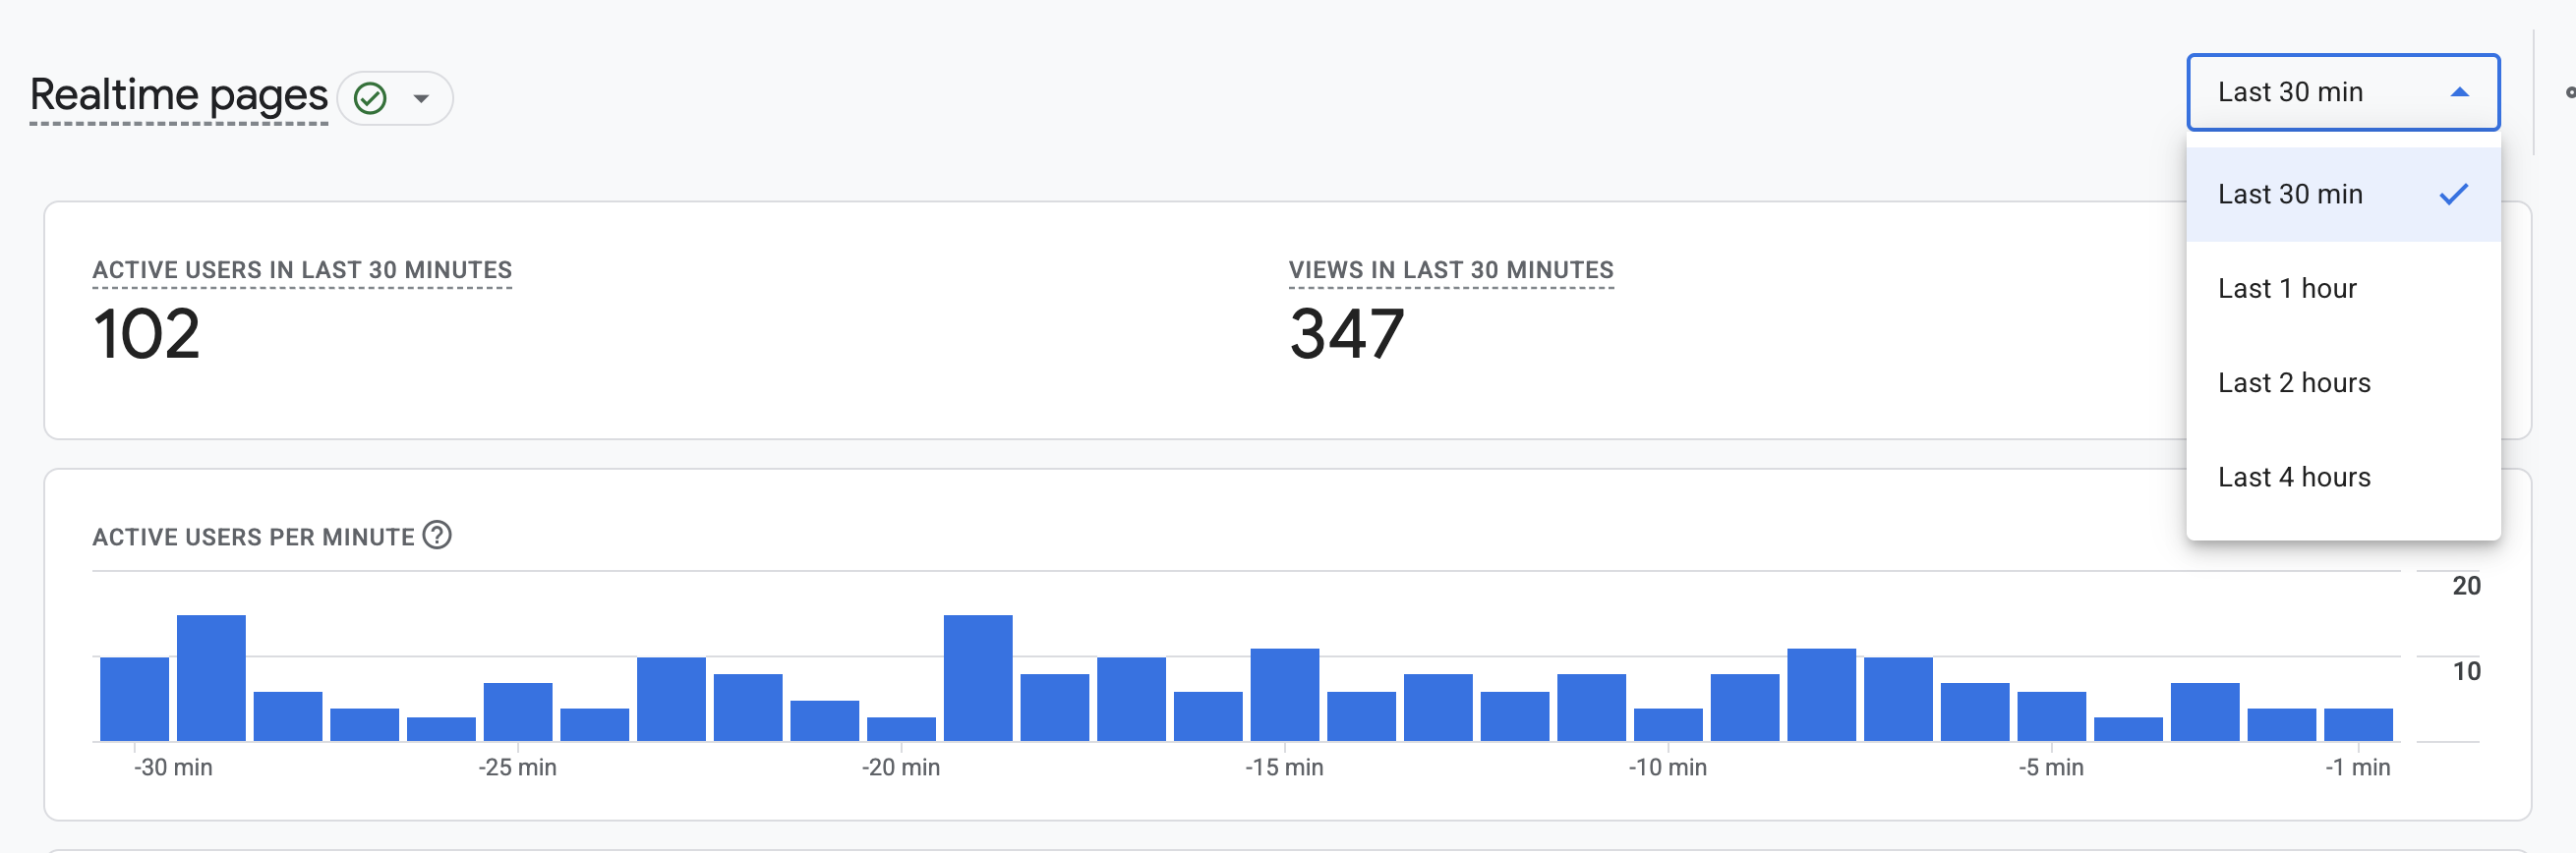
- Locate the dropdown menu near the top right of the data cards (it will default to "Last 30 min").
- Click the dropdown and select Last 1 hour, Last 2 hours, or Last 4 hours to extend your view.
Server Monitoring vs. Marketing Analytics
It is common to wonder why you would use GA4 for real-time monitoring when server-side tools like Cloudflare or Dynatrace exist. While IT teams rely on those tools during a launch, they serve a completely different purpose than marketing analytics.
Server logs show raw requests, uptime, and infrastructure load. They cannot always tell you if a specific audience is engaging with your content or if users are navigating through your funnel as expected.
While we are still waiting to see if the full suite of real-time widgets (like Event count, Key events, and First user source) will adopt the 4-hour window, GA4 Realtime inherently allows you to measure marketing performance and user behavior, not just server stability.
Why GA4 Realtime Excludes the Sessions Metric
A common complaint about the GA4 Realtime report is the absence of the "Sessions" metric. Many marketers still rely heavily on sessions for early launch reads and find it difficult to transition to the alternative metrics Google provides.
Google Analytics Product Managers have confirmed that calculating real-time sessions is technically prohibitive at scale. A session is officially defined by a period of activity followed by 30 minutes of inactivity. Attempting to calculate and close sessions on the fly for live traffic leads to highly inaccurate data. This technical limitation is exactly why the Universal Analytics real-time report was notoriously unreliable compared to GA4.
To adapt to this, your reporting strategy must shift toward the metrics readily available to you.
Transitioning to Active Users and Views
Because you cannot rely on sessions, you must understand exactly how Google defines the primary metrics available on the Realtime pages report:
- Active Users: An active user is any unique individual who either has an "engaged session" (lasts longer than 10 seconds, completes a conversion, or views multiple pages) OR visits your site for the very first time. It is important to note that even if a first-time visitor bounces immediately, GA4 still counts them as an Active User simply because the
first_visitevent fired. - Views: Formerly known as pageviews, this metric shows the total number of web pages or app screens your users consumed.
Instead of trying to force session-based math into your live reporting, focus on the relationship between these two data points. By calculating the ratio of Views to Active Users, you can quickly gauge how often individuals are refreshing a page or returning to key content during your launch window.
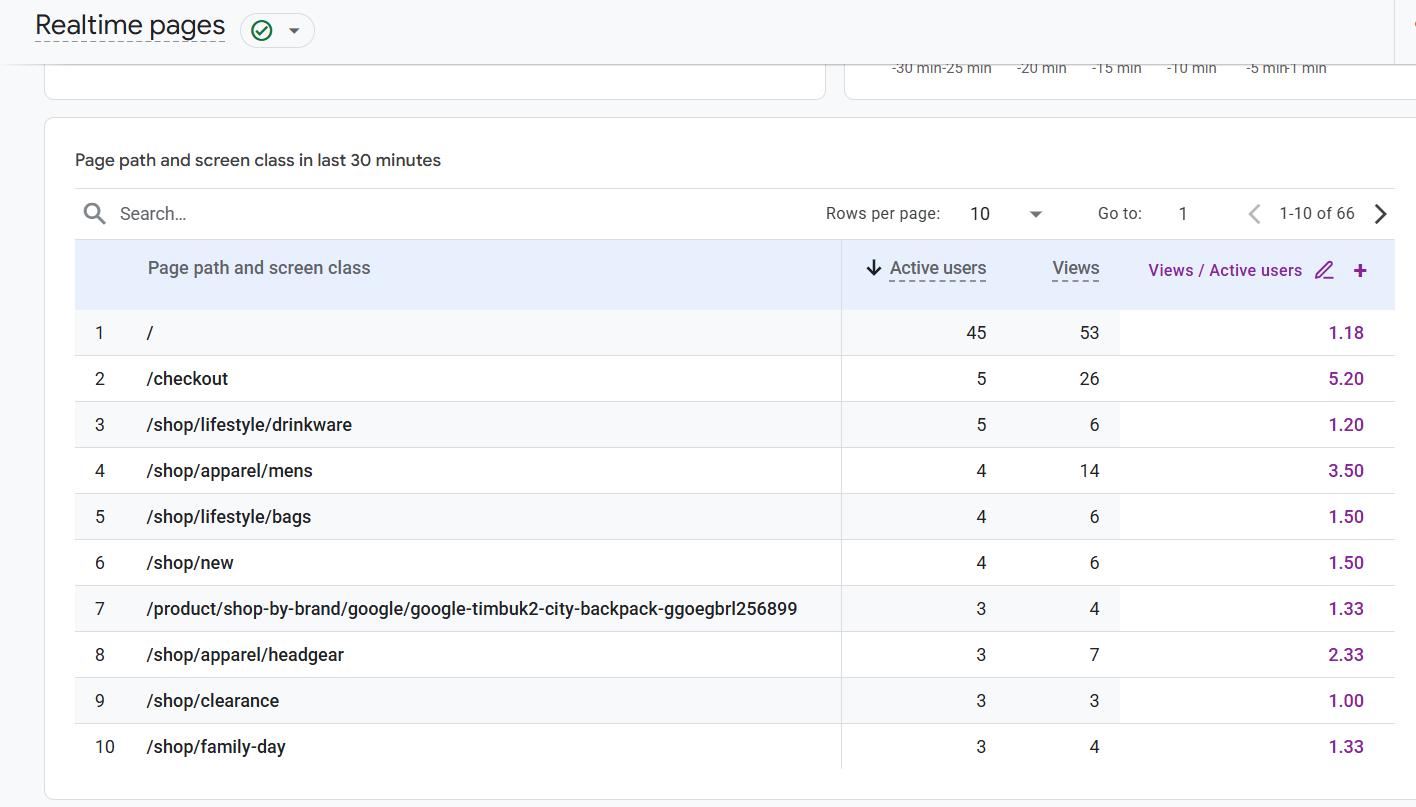
To track this ratio automatically without doing manual math, you can install the free GA4 Optimizer Chrome extension. The extension's Quick Calculated Metric feature lets you add a custom "Views / Active users" column directly into your Realtime tables. It also injects other missing workflow features, such as increasing table limits to 500 rows and bypassing aggressive data sampling warnings.
Frequently Asked Questions
How do I access the 4-hour Realtime report in GA4?
Click the Reports icon in the left-side navigation panel, then click on Realtime pages. Click the dropdown menu at the top of the report cards (which defaults to Last 30 min) and select Last 1 hour, Last 2 hours, or Last 4 hours.
What metrics are available in the GA4 Realtime pages report?
The GA4 Realtime pages report primarily focuses on Active Users (unique engaged individuals or first-time visitors) and Views (total web pages or app screens consumed) during your selected 30-minute to 4-hour window.
Why did GA4 extend Realtime reports to 4 hours?
Google Analytics 4 extended the Realtime window to bridge the gap between immediate live traffic and the standard 24 to 48-hour data processing delay, giving marketers a longer timeframe to analyze recent website activity.
Why doesn't the GA4 Realtime report show sessions?
Calculating session timeouts on the fly for live traffic is technically prohibitive and leads to highly inaccurate data. Because a session typically expires after 30 minutes of inactivity, GA4 relies on the Active Users metric instead.
What is an Active User in GA4?
An active user is any unique individual who either has an engaged session (lasts longer than 10 seconds, completes a conversion, or views multiple pages) OR visits your site for the very first time.
How do I calculate Views per Active User in GA4 Realtime?
You can calculate this metric by dividing total Views by Active Users. To do this automatically, install the GA4 Optimizer browser extension and use the Quick Calculated Metric feature to add a custom ratio column directly into your Realtime tables.
Can I use GA4 Realtime for server performance monitoring?
No. While GA4 Realtime is excellent for tracking traffic spikes and potentially monitoring marketing engagement during a launch, it should not replace dedicated server monitoring tools like Cloudflare or Dynatrace for measuring infrastructure uptime.