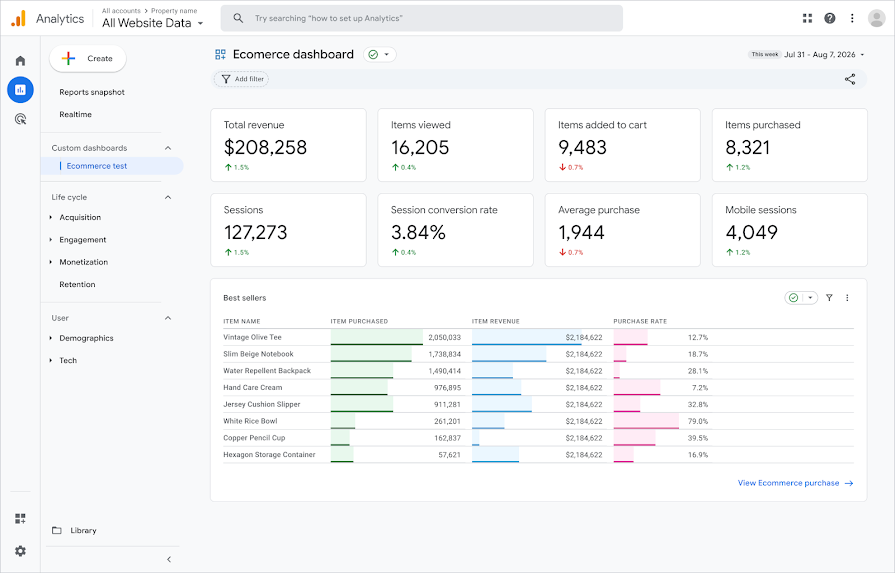
Google Analytics is rolling out a lightweight custom dashboard builder natively inside the platform. It is live in most active properties right now, and you can spot it by looking for a new "+ Create" button at the top of your report list.
Since the sunset of Universal Analytics, the analytics community has asked Google for a middle ground. GA4 has historically forced users into two extremes. You either use rigid Standard Reports that lack customization, or you use the Explorations workspace which is far too complex to share with a non-technical executive.
This new dashboard feature bridges that gap. It acts as a simplified version of Data Studio directly inside your analytics property. We spent time building dashboards, testing every export path, and hunting for metrics that Google normally hides. Here is what we found.
What We Found in Testing
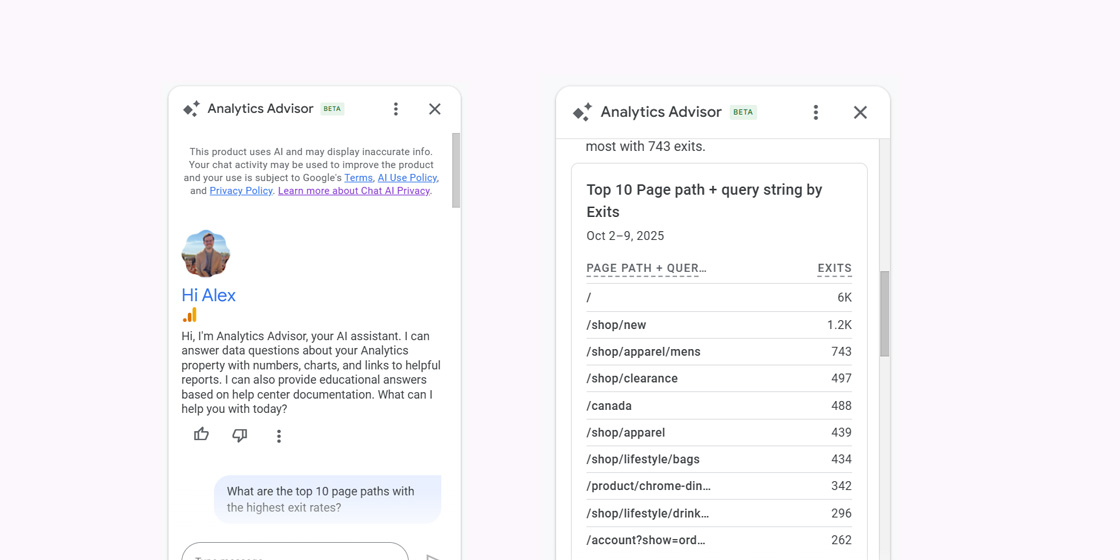
- Exits metric and Page Referrer are selectable here. Both are still blocked in standard report customizations, and Data Studio does not expose Exits at all. Note: this is raw Exits, not Exit Rate.
- Google Ads cost metrics work natively if your account is linked. Search Console metrics do not appear.
- Exports can be buggy. PDF clips long dashboards, Google Sheets export does nothing, and full-dashboard CSV is unusable.
- No text or description blocks, so analysts cannot annotate context for stakeholders.
- No Data API quota issues. Unlike Data Studio, native dashboards pull data directly from within GA4, so no quota errors or broken reports.
- Verdict: a genuine upgrade for customizing standard reports, not a Data Studio replacement.
Where to Find the Dashboard Builder
To start building, check your left navigation panel:
- Navigate to the Reports section in the left navigation menu.
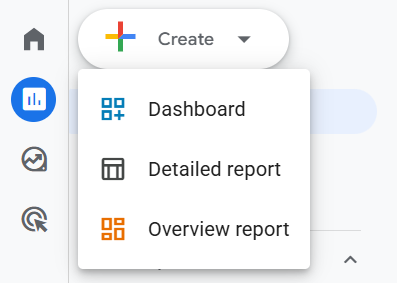
- Click the new + Create button at the top of the Report left navigation panel.
- Select Dashboard.
- Drag and drop your dimensions and metrics onto the canvas.
When you click Publish, the dashboard goes straight to your left navigation menu. You no longer have to dig through the messy GA4 Library to publish a custom view.
What You Can Build
The builder focuses on speed over deep customization. It gives you an auto-expanding, grid-based canvas supporting score cards, line charts, bar charts, donut charts, funnel charts (both open and closed), and data tables with multiple dimensions.
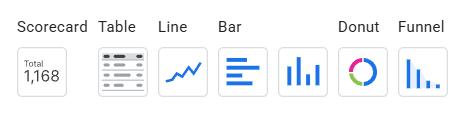
Each dashboard supports up to 15 cards (30 for GA4 360 properties), which is generous for a focused executive view.
Access rules are simpler than Explorations, which are notorious for becoming read-only the moment you share them. To create or edit a dashboard you need an Editor or Administrator role. Once published, anyone with property access (including Viewers) sees it in their left-hand menu.
The Good Surprises: Metrics You Could Never Access Before
This is the finding we did not expect.
Google quietly made the raw Exits metric and the Page Referrer dimension available as selectable options inside this tool. Both remain completely inaccessible in standard report customizations. Even in the more powerful Data Studio, Google does not expose Exits as a usable metric. Yet here it is.
This is not the same as Exit Rate. You cannot select Exit Rate directly. But having raw Exits available is still a meaningful find for analysts who previously had zero access to this data outside of Explorations. Pair it with a total pageviews widget and you can derive Exit Rate yourself. It signals that Google is treating this dashboard builder as a more permissive reporting surface than standard reports.
Google Ads metrics are the second win. If your property has a linked Google Ads account, ad cost and related advertising metrics appear natively. You can add cost, clicks, impressions, and cost-per-click widgets with no extra configuration, which previously meant a trip to Data Studio. Google Search Console metrics do not appear, so organic search performance still needs a separate reporting surface.
Where It Falls Short
A shiny new dashboard is only as useful as the data feeding it, and several gaps will affect how you use this tool.
- No text or description blocks. You cannot add free-text panels or analyst notes. The only workaround is the dashboard title's dotted underline, which shows a tooltip with the dashboard description on hover.
- No styling control. You cannot apply custom branding, change colors, or adjust layout styling.
- No segments or card-level comparisons. Confirmed in the official documentation. You cannot build a widget showing only traffic from a specific audience segment.
- No on-the-fly calculated metrics. You are limited to native GA4 metrics. Custom Click-Through Rates or unique conversion ratios are not supported and limited to what you can build using limited GA4 native metric creation functionality.
- Lack of regex filter. Currently, when adding a filter to individual cards, regex is not an available option, significantly limiting dashboarding filtering.
- No cross-platform data. Other than Google Ads, there is no data blending. This is strictly a visualization layer over data already inside GA4.
- Funnel chart metric bug. The editor lets you change the funnel metric away from Active Users, but this appears to be unintentional. The chart itself ignores the selection and still renders Active Users regardless of what you pick. Additionally, unlike Explorations funnels, you cannot apply segments to dashboard funnel charts.
- Clunky date comparisons. Date comparisons work on Scorecards and show percentage differences, but the native date picker still takes multiple clicks to set up.
Export and Sharing: What Actually Works
We tested every export and sharing path. The results are mixed enough to matter if you plan to distribute these dashboards.
| Method | Status | What Happens |
|---|---|---|
| CSV, single chart | Works | Clean columns, correct data. The most reliable export in the tool. |
| CSV, full dashboard | Messy | Every card is crammed into one file. CSV does not support multiple sheets, so a 5-column table stacks directly on a 3-column table with no separator. |
| Download PDF | Clipped | Only captures the top portion of the canvas. Bottom-row widgets get cut off on long dashboards. |
| Export to Google Sheets | Broken | Modal opens, spins for a few seconds, then closes. No sheet is created and no error appears. |
| Send via email | Partial | PDF and CSV attachments inherit the problems above. The "View Report" button linking to the live dashboard is the dependable part. |
If your team has GA4 property access, skip the attachments and share the live dashboard link. It is the only path that works consistently.
How to Fix the Remaining UI Limits
If you plan to move stakeholder reporting onto these native dashboards, you need tools to cover the gaps Google left open.
This is exactly why we built the free GA4 Optimizer Chrome extension. It sits on top of your GA4 property and fixes workflow gaps across the interface. Here is what is live now and what is coming for the new dashboard builder:
Newly released fixes from us for the Dasboards:
- % of Total in Dashboard Tables: The new table cards do not show what percentage of the total each row represents, which makes it hard to judge contribution at a glance. If the table includes a total, our update will inject a "% of Total" column.
- Date Presets Inside the Dashboard: Our 1-click date presets will appear right next to the native date picker in the dashboard tool. Switch between Last 7 Days, Last 30 Days, MTD, or QTD without the multi-step modal.
Already working in Standard Reports and Explorations:
- Create Missing Metrics: Use Quick Calculated Metric to build and inject custom conversion rates directly into your standard reporting data tables. Not yet available inside native dashboards, but functional everywhere else.
- Accurate Date Comparisons: A modifier button forces true day-of-week aligned Year-over-Year comparisons in standard reports and Explorations. We plan to bring this to the dashboard tool as well.
- Advanced Table Filters: Universal Analytics style advanced filtering lets you slice data by greater than or less than conditions in standard reports. Dashboard support is on the roadmap.
The Verdict: Should You Abandon Data Studio?
It depends on your business maturity but likely no, at its current functionality it is far too limited.
If you run a small business or manage basic lead generation campaigns, these dashboards are a welcome addition. Keeping everything in one platform without managing API quotas is a real operational win, and the surprise access to the Exits metric and Page Referrer makes it more capable than the feature list suggests.
For enterprise analysts and complex tracking architectures, Data Studio and BigQuery are not going anywhere. No calculated metrics, no styling control, no segments, and unreliable exports keep this out of true BI territory. You still need an external environment to apply complex segments, blend ad data, and apply custom branding.
Read it as a big win for customizing standard reports, because that is where this tool lives and where it earns its place. It gives analysts a flexible presentation layer over standard report data without external tools or quota concerns. The export and sharing side needs work before it can replace a polished Data Studio setup for stakeholder distribution.
Google has also teased that future updates will let you build dashboards from AI text prompts, which will likely tie into their recent Ask Advisor Gemini 3 upgrade. We hope that the current state is in beta an further customizations are added.
Frequently Asked Questions
What are GA4 custom dashboards?
GA4 custom dashboards are a native reporting feature that lets you create drag-and-drop data visualizations directly inside the Google Analytics 4 interface. They act as a lightweight alternative to Data Studio for building executive summaries without hitting Data API quotas.
Can you use the Exits metric in GA4 native dashboards?
Yes. The raw Exits metric and Page Referrer dimension are both available as selectable options inside the new GA4 dashboard builder, even though they remain inaccessible in standard report customizations and Data Studio. Exit Rate itself is not directly available, but you can derive it from Exits and total pageviews.
Does the GA4 dashboard CSV export work correctly?
Exporting individual chart cards to CSV works well. However, exporting the entire dashboard to a single CSV file combines all card data into one table with inconsistent column counts, making the output difficult to use without manual cleanup.
Will GA4 native dashboards replace Data Studio?
Not for advanced users. Native dashboards bypass GA4 Data API quota limits and provide quick executive summaries, but Data Studio is still necessary for data blending, advanced formatting, cross-platform reporting, and segment-level analysis.
Do Google Ads metrics appear in GA4 custom dashboards?
Yes. If your GA4 property is linked to a Google Ads account, ad cost, clicks, impressions, and cost-per-click metrics are natively available in the dashboard builder. Google Search Console metrics are not available in this tool.